Root Cause Analysis of Industrial Accidents
Overview
Business Problem
One of the most important factors in industrial site management is to ensure the utmost safety of human labor. Unfortunately, in 2018, the United States saw 5,250 fatal work injuries (US Department of Labor). The difficulties that come with trying to prevent work injuries fall into the lack of safety inspection resources. While government agencies such as Federal OSHA have about 2,100 inspectors, they are responsible for the health and safety of 130 million workers who are employed at more than 8 million worksites around the country. This equates to approximately 1 inspection officer for every 59,000 workers.
Inspectors can shut down an industrial site if they have reason to believe it is home to unsafe conditions. However, due to the large volume of visits each officer generally has to make on a regular basis, it becomes difficult for them to granularly ensure full-proof inspection of all industrial sites. Conducting a root-cause analysis of past accidents at each site to prevent future occurrences require unfeasible amounts of time. Inspectors and companies alike are unable to ensure complete safety across all their sides due to the highly manual and laborious inspection strategies currently in place.
Intelligent Solution
With advancements in automation and predictive analytics, AI helps manufacturers take faster and more accurate approaches to analyzing the root cause of past accidents. Having a deeper understanding of what caused accidents in the past allows manufacturers to implement new safety practices and protocols that will prevent these accidents from reoccurring in the future.
The first step to conducting sound root cause analysis is to identify the true severity of past accidents. The reason behind this is that workers may sometimes understate the severity of accidents to their evaluation officers. For this, models trained on reliable severity data can predict the true severity of all accidents that have occurred in the past. The target variable for this use case is whether the potential severity level of an accident was greater than the reported severity level. It’s important to mention this target variable can be framed differently depending on the data available and intended objectives.
Once evaluation officers have a clear understanding of the severity level of past accidents, the second step is to leverage advancements in model transparency to unravel the top statistical explanations behind each accident’s occurrence. Models capable of handling both structured and unstructured text can dig through accident notes to get better predictive signal and insights. Worksite personnel can then use the model predictions and its explanations to implement new but necessary safety measures.
Value Estimation
How would I measure ROI for my use case?
- For any workplace accidents or injuries that result in stoppage production or processes, the impact can be directly related to a loss in man hours, which directly leads to a loss in production and eventually to a loss in business value.
- Any kind of workplace accident is generally followed by increasing inspections and evaluation on top of regular cadence; this extra scrutiny requires investment of extra resources of time, resources, and manpower. Also, the likely addition of safety training and surveillance cameras increases the security team budget.
Technical Implementation
About the Data
For illustrative purposes, we are going to be using a sample dataset on industrial safety and health analytics, which is publicly available on Kaggle. The dataset contains records of accidents from 12 different plants in 3 different countries, and every unit of analysis in the data is an occurrence of an accident. Based on the given history of past accidents, the model would be used to predict the potential severity level of the accidents in order to make better and safer data-driven decisions.
Problem Framing
The target variable for this use case is whether the potential severity level of the accident is greater than the reported severity level. If the potential severity is more, then the label is 1, otherwise 0. (Binary; True or False, 1 or 0, etc.). This choice for target makes this a binary classification problem. The distribution of the target variable is imbalanced with 80% being 1 (potential severity higher than reported severity) and 20% being 0 (potential severity being lower than actual reported severity).
The features below represent some of the factors that are important in predicting accident severity. The feature list encompasses the information which is generally available when the accident occurs and would eventually be used to make predictions of potential accident severity when future accidents occur as well assist the safety officer with root cause analysis of the historical accidents.
Beyond the features listed below, we suggest incorporating any additional data your organization may collect that could be relevant to accidents. As you will see later, DataRobot is able to quickly differentiate important vs unimportant features.
Other information can also be added to make the model better and capture possible further predictive signal, such as:
number of people involved in the accident,
number of people available at the accident site,
related safety instructions at the accident site,
whether the person involved in the accident had thorough safety training,
timeline of the last safety training given to the person in the accident etc.
This additional information has not been added in this sample dataset, which is as shown below.
Sample Feature List
| Feature Name | Data Type | Description | Data Source | Example |
|---|---|---|---|---|
| Description | Text | The notes that describe the accident | Accident site inspection report | |
| Country | Categorical | The different countries where the accidents occured | Accident site inspection report | Brazil |
| Date | Datetime | The date of the accident | Accident site inspection report | 22nd July 2018 |
| Accident Level | Categorical | The level of severity reported during site inspection | Accident site inspection report | Level II, III |
| Potential Accident Level | Categorical | Target – Whether the level of potential accident severity is greater than the reported accident level | Inspection officer review or analysis report | True or False |
| Critical Risk | Categorical | The description of the risk involved in the accident | Accident site inspection report | Fall, vehicle equipment |
| Employee or third party | Categorical | Whether the accident occurred with an employee or a contract person | HR employee database | Third party employee, full time employee |
| Local | Categorical | The city at which the manufacturing plant is located (anonymized) | Accident site inspection report | local_01, local_02 |
Data Preparation
Each row of analysis in the dataset originates from individual accidents that have occurred, and the target variable is whether the potential severity level exceeds the reported severity level. For each accident, if the potential severity is greater than the reported severity, then the target variable has the value 1, else 0. Overall, the dataset contains approximately 430 rows and 12 features, including the target variable. Once the new target variable is created in Python, the dataset is uploaded into DataRobot and a new feature list is created by removing the original “Potential Accident level” column that had the stated severity level. We remove this as it would cause redundancy and leak information to our binary target variable.
Model Training
Before we start the modeling process, it is critical to define the optimization metric to run the model. In this case, since we are dealing with an imbalanced dataset, the platform automatically recommends using LogLoss (since it is an error metric which penalizes wrong predictions) in order to fit a better model.
We used DataRobot Autopilot modeling mode which automates the process of data preprocessing, feature engineering, building machine learning models, and getting them ready for deployment. With DataRobot automating many parts of the modeling pipeline, users (data scientists and data analysts) are now able to focus on solving business problems, instead of spending months hand-coding and manually testing dozens of models to find the one that best fits their needs.
The platform automates out of sample validation thereby ensuring no leakage of information in training data; hence, preventing overfitting. Since the dataset is generally imbalanced, the platform automatically chooses a stratified sampling strategy in order to ensure each partition has the right representation of the population. For this particular dataset, we hold out 5% of the data as a holdout set and we used a 3-fold cross-validation strategy so that there are enough records in the validation folds to get better model insights.
We will jump straight to interpreting the model results.
Interpret Results
From a business perspective, the major benefit for solving this problem is to get actionable insights from the model. To help with interpretability, DataRobot provides both global-level and local-level model explanations. On the global-level, the model can be understood by looking at Feature Impact, which determines the relative importance of the features in the dataset to the target variable selected. DataRobot Feature Impact is model agnostic, a benefit compared to the alternative method of Tree based Feature Importance.
The technique adopted by the platform that helps to build these model-agnostic interpretations is called Permutation Importance. This technique also enables the platform to highlight redundant features (features that are highly correlated) which helps the business user decide whether to keep the feature. In this case, the model identified these features as some of the most critical factors affecting potential accident severity: Description, Accident Level, Local (location of the manufacturing plant), Countries (of the accident), Industry Sector (redundant with countries).
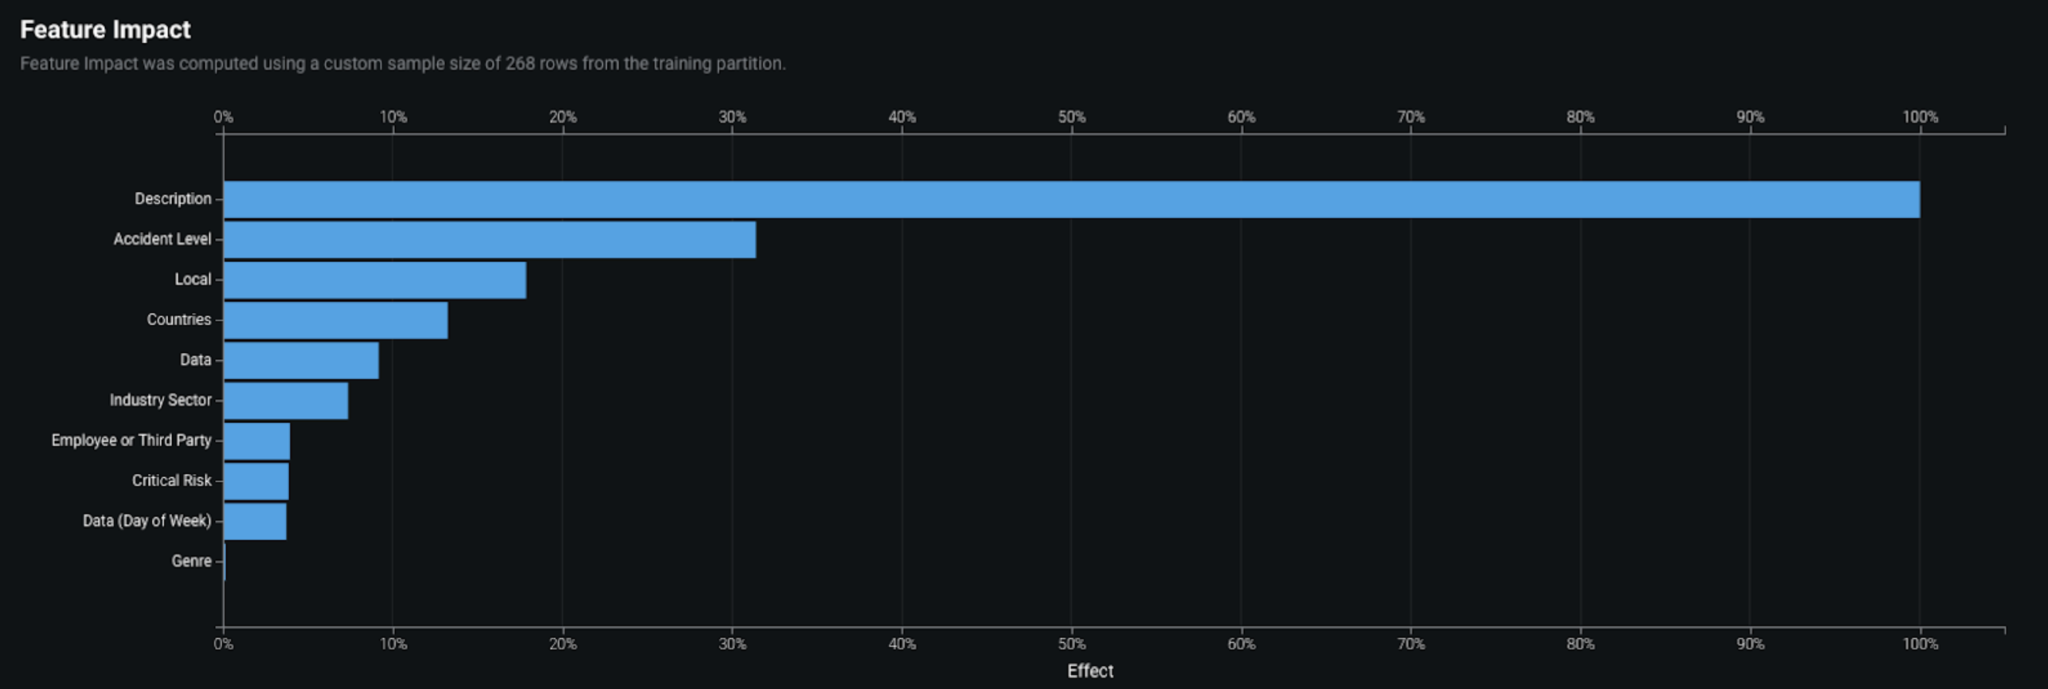
Now that we understand the most critical parameters of the model, we can look into the directional relationships for each of the important features. DataRobot’s Feature Effects helps plot the partial dependence plots for each individual feature, thereby helping us run a sensitivity analysis on the model. We see below that accidents that have reported levels of I, II, III are twice as likely to have a higher potential severity level.

Further, accidents in Country_01 and Country_02 are almost twice as likely to have higher potential severity relative to Country_03.

An analysis can also be done for other variables such as the Industry Sector of the company, which reported accidents in metals and mining to be potentially more severe.

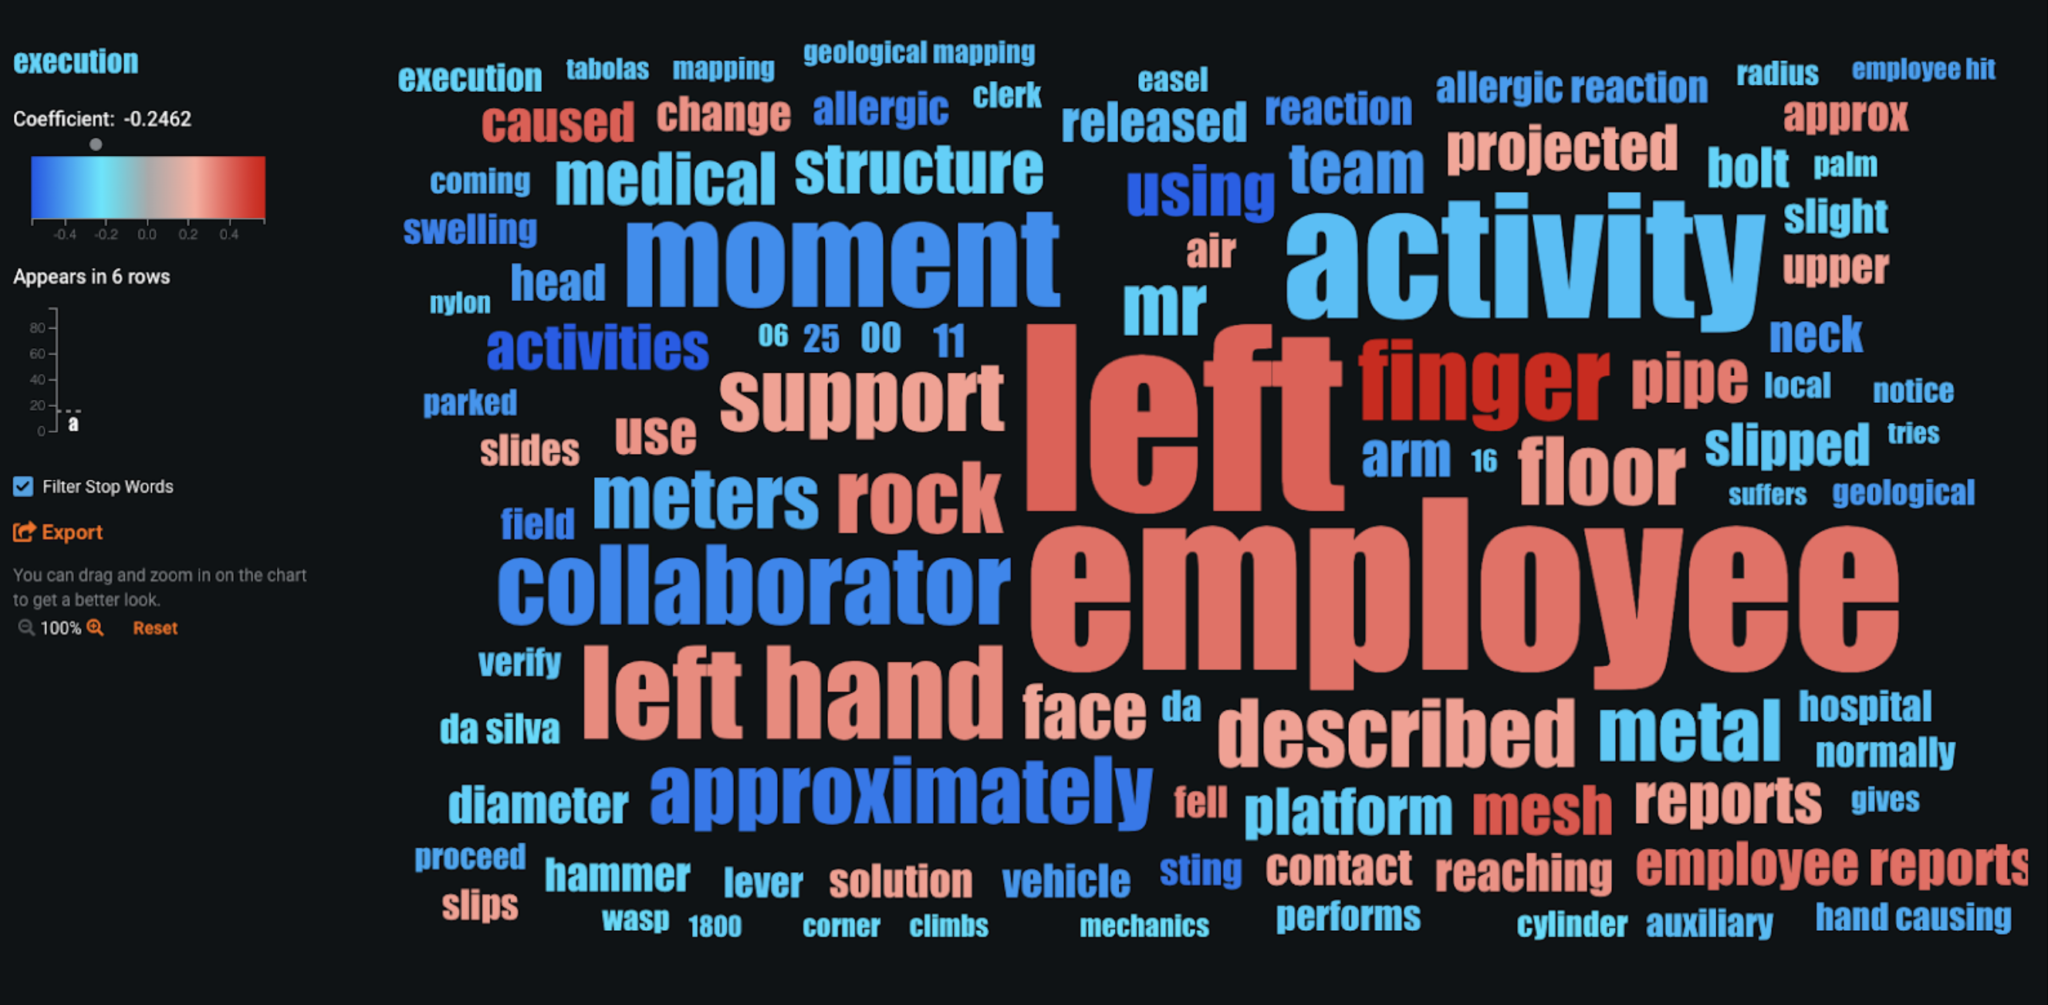
For the text variables such as Description (of the accident) in the dataset, we can do also do a similar analysis. DataRobot leverages NLP capabilities that fit individual models on individual text columns which eventually get stacked in the final model for overall predictions. We look at Word Clouds that are generated for the text models; these help explain the words or phrases that are highly associated with the target variable.
Text features are generally the most challenging and time consuming when building models and getting insights. However, with DataRobot, each individual text column fits an individual classifier along with NLP preprocessing techniques (tf-idf, n grams, etc.) In this case, we can see that items described using words such as finger, mesh, and left hand are more likely to have more severe potential accidents.
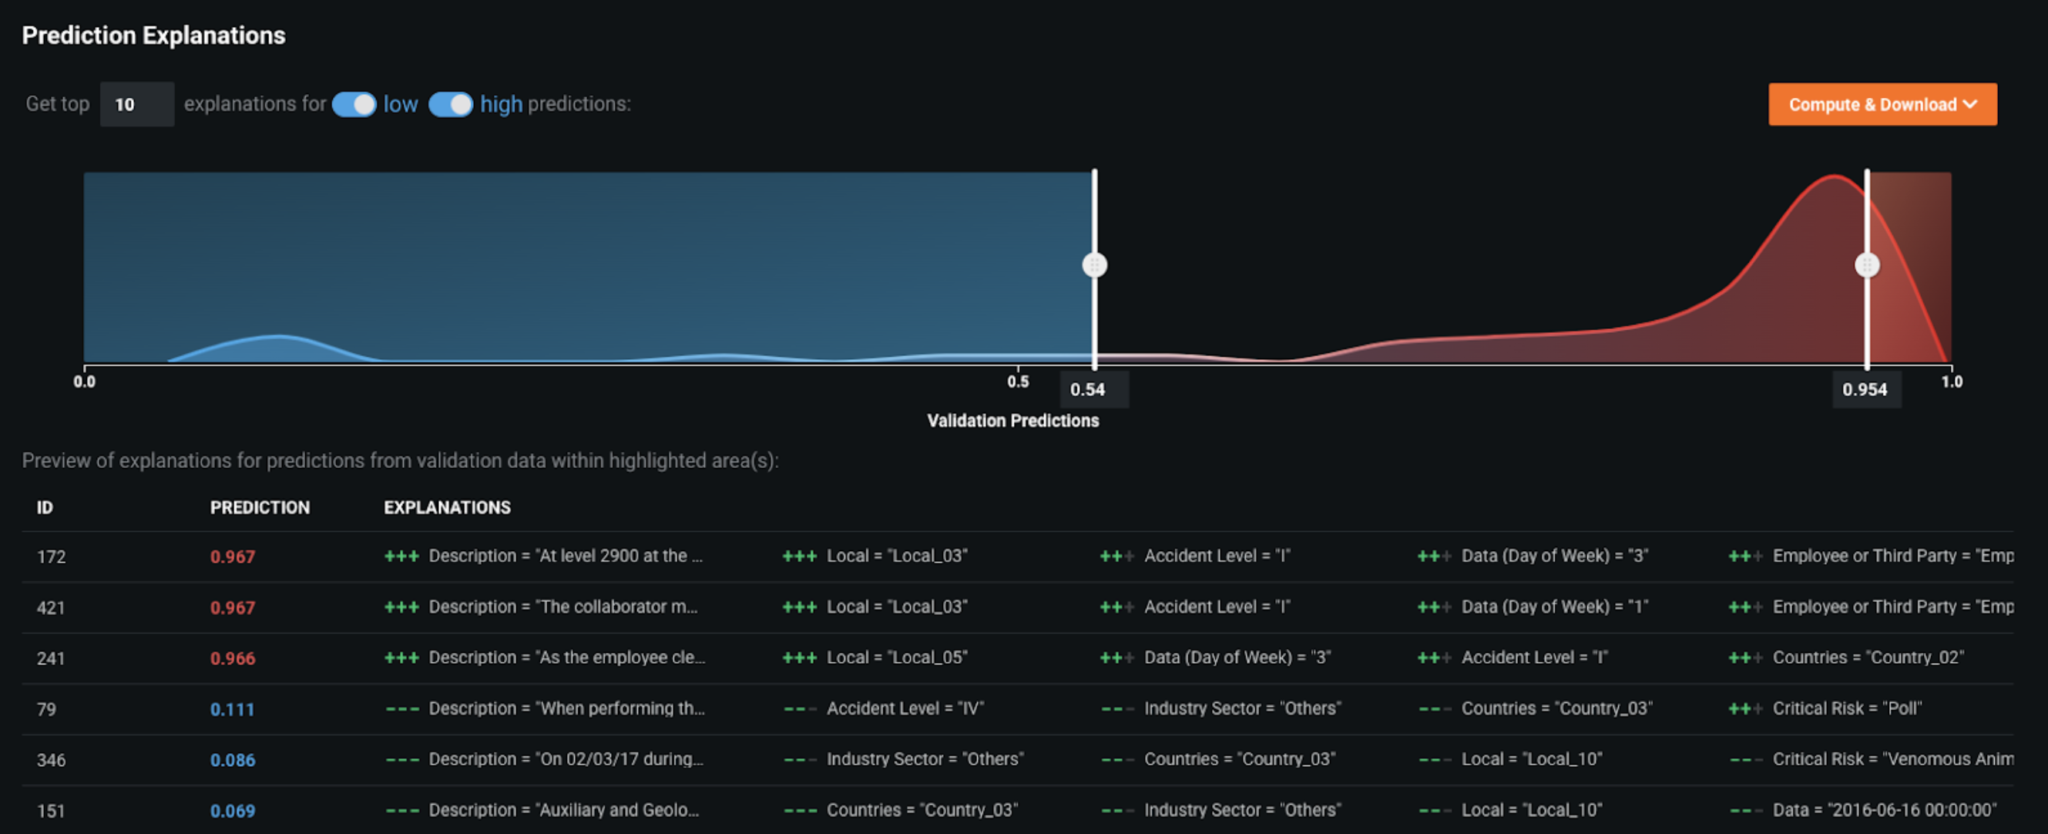
On the local-level, the platform provides Prediction Explanations that enable the businesses to understand the top 10 key drivers for each prediction. In this case, for every accident that occurs the business can leverage the explanations to understand why the prediction has a high- or low-likelihood of severity.
These insights allow the business to take actionable responses; for example, if there’s a particular accident with a 96% likelihood of being potentially severe, we can analyze the Word Cloud and learn that description was the most important feature. In this case, we observe that the most potential severe accidents had words such as rock and employees in the description and they had initially been reported as Level 1 accidents.
Evaluate Accuracy
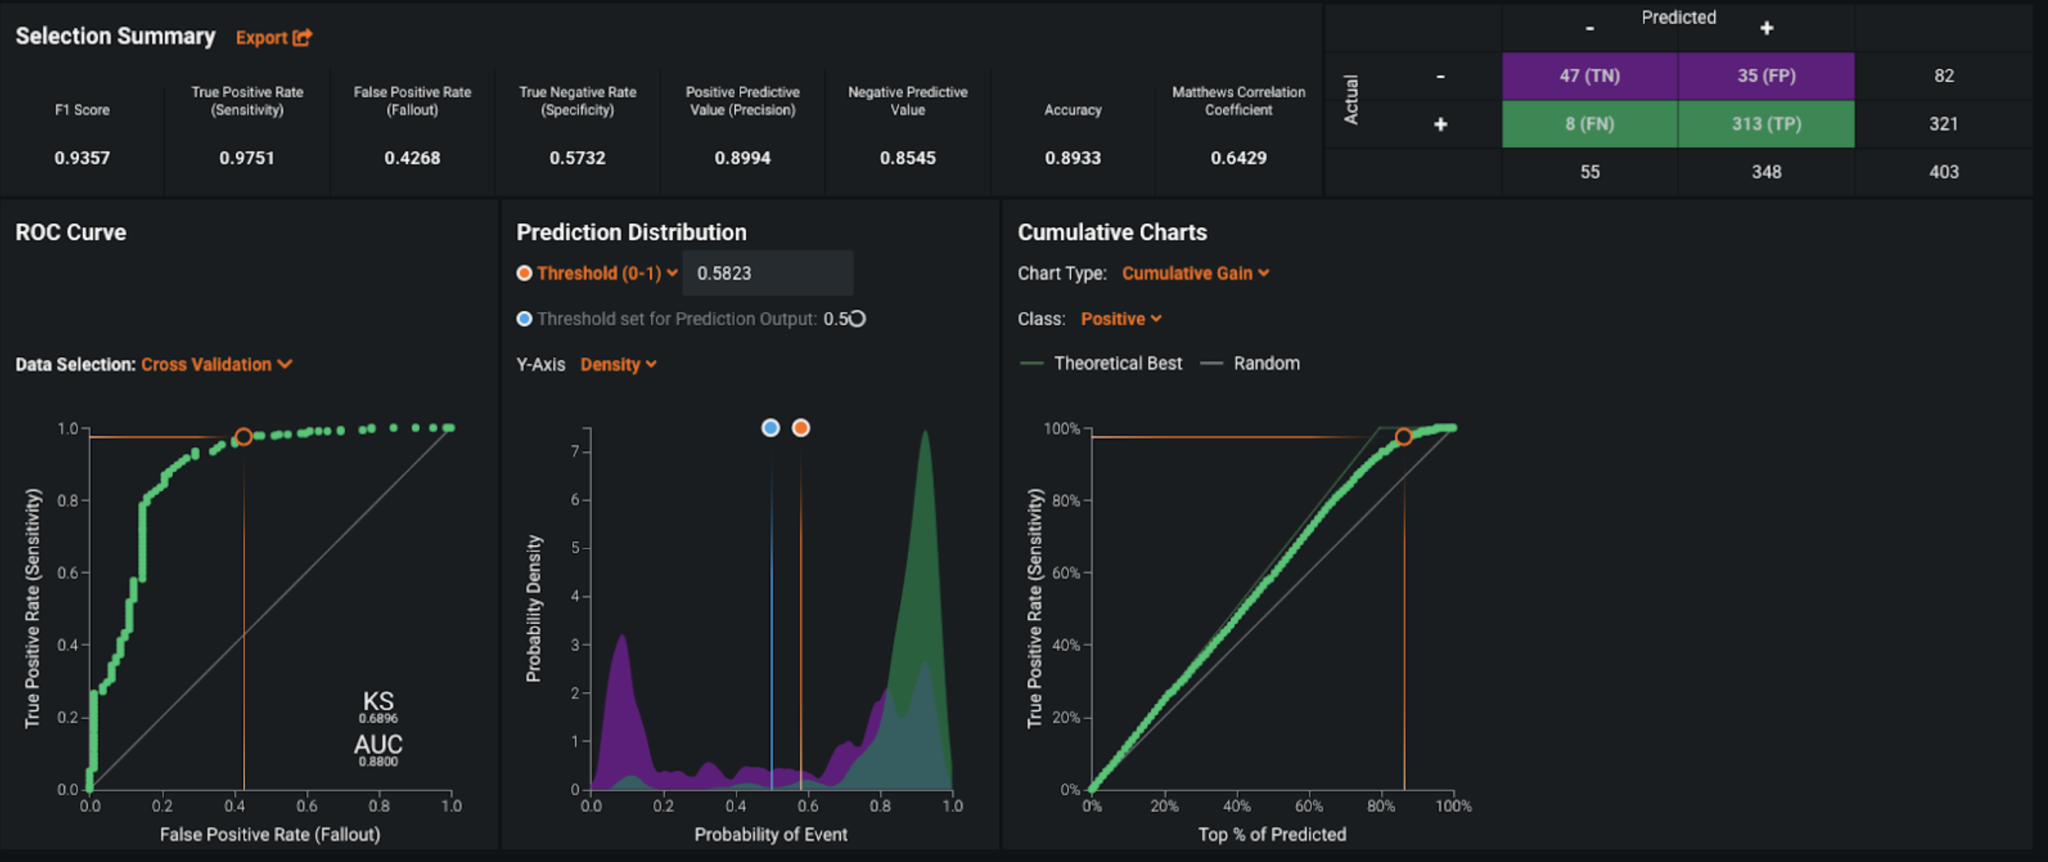
In order to evaluate the performance of the model, DataRobot ran 3-fold cross-validation; the resulting AUC score (for ROC Curve) was around 0.88 and LogLoss of 0.27. As the AUC score on the holdout set (i.e., the unseen data) was also around 0.88, we can be reassured that the model is generalizing well and not overfitting.
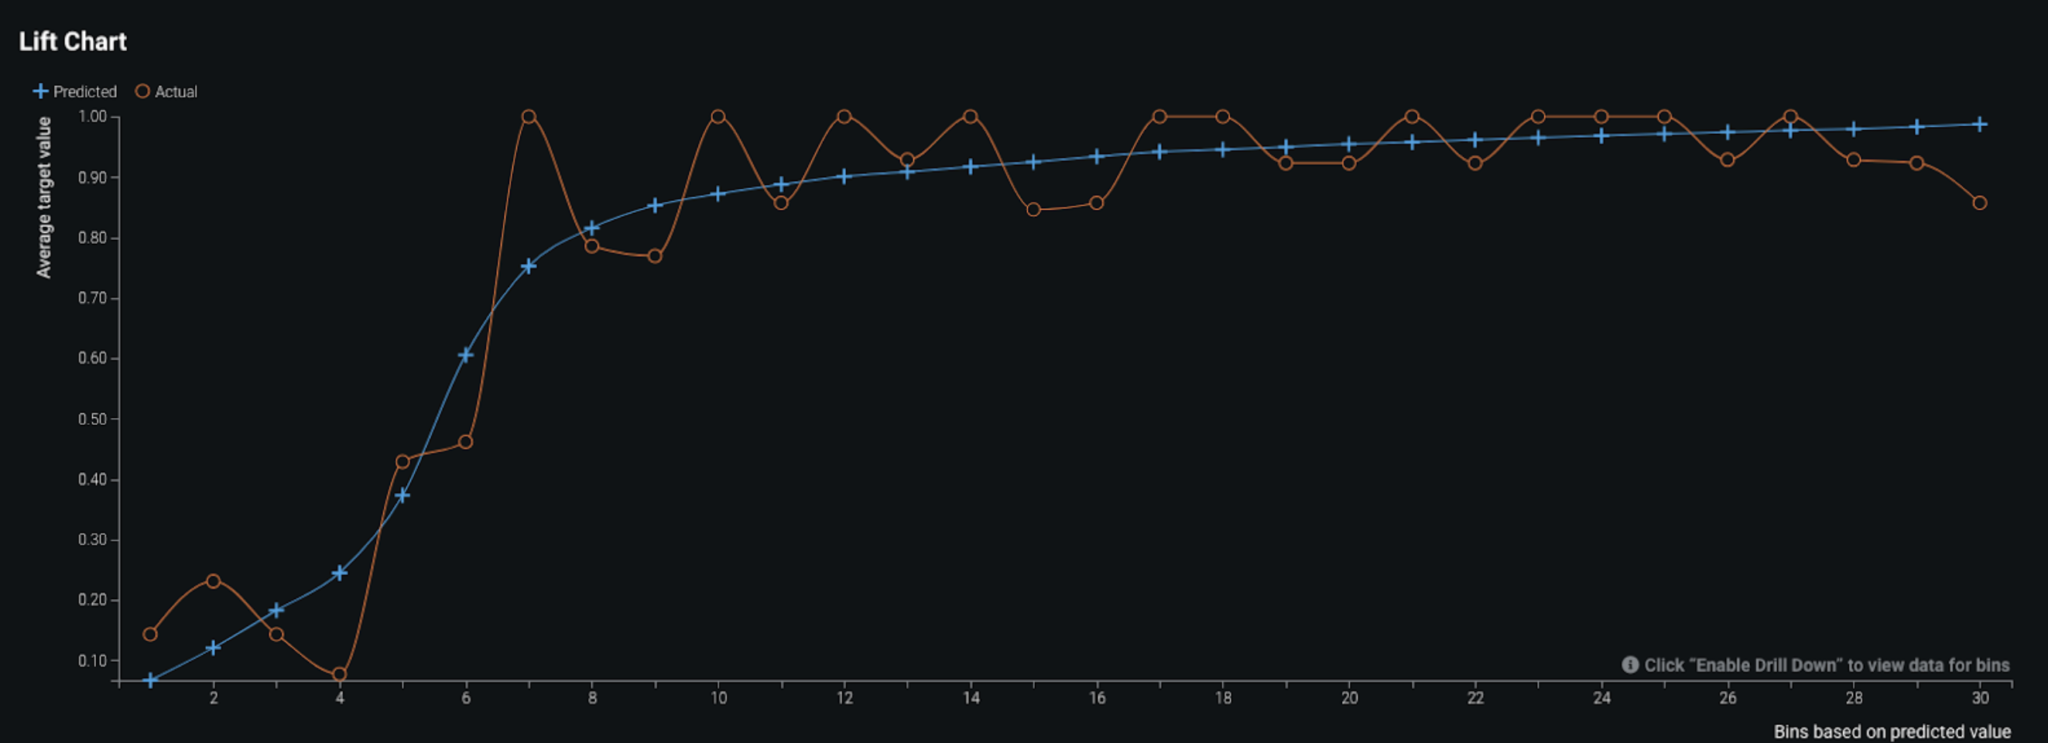
The higher the AUC score (i.e., closer to 1), the better the model is able to separate the positive and negative prediction classes. The Lift Chart below shows how predicted values compared to actual values when the data is sorted by different bins of predicted values. We see that the model had some minor under-predictions and over-predictions for the accident potential severity. That said, overall, the model does perform well.
Furthermore, depending on the problem being solved, you can review the confusion matrix for the selected model and adjust the prediction threshold to optimize precision and recall, if required. In this case, we do not really need to optimize precision or recall so we do not really dig deep into prediction thresholds. However, we do see the model has fairly high recall (0.97) and high precision (0.90) thereby showing the model’s strong performance. These values tell us the model rarely overlooks any actual potential severity.
Business Implementation
Decision Environment
After the right model has been chosen—based on performance in terms of accuracy and time taken to score the predictions (using speed vs accuracy plots in the platform)—DataRobot makes it easy to deploy the model into your desired decision environment. Decision environments are the ways in which the predictions and prediction explanations generated by the model will be consumed by the appropriate stakeholders in your organization and how they will ultimately make decisions using the predictions that impact your process. These environments when augmented with the reasons along with predictions effectively helps in change management and overcoming the Trust and implementation barrier in organizations.
This is a critical piece of implementing the use case as it ensures that predictions are used in the real world to identify root causes for safety risk and take corrective action based on the insights generated by the model predictions and prediction explanations.
Decision Maturity
Automation | Augmentation | Blend
At its core, DataRobot empowers the safety officers—both at the organization level and the government agency level—with the information they need to ensure that proper root cause analysis was done and proper safety measures and laws could be enforced accordingly. The predictions from this use case are augmenting the decisions made by the industrial safety officers as they determine any upcoming accidents severity level. When combined with decisions the managers make, the predictions act as an intelligent machine to help improve the workplace safety.
Model Deployment
In this case, the model can be deployed using the DataRobot Prediction API which basically means that the model has a REST API endpoint which would be used to bounce back predictions in near real time when the new scoring data of new orders is sent. However, the platform also provides the option to download the scoring code of the model for deployment outside the DataRobot environment, in the organization’s own, pre-defined deployment environment.
Once the model has been deployed, the predictions can be consumed in different ways. In this particular example, a frontend dashboard can be implemented to run what-if analysis scenarios on the deployed model.This method takes new scoring data of new accidents as input by providing the relevant fields which at the backend bounces back the prediction and prediction explanations from the deployed model in real time.
Decision Stakeholders
The predictions and the prediction explanations would be used by safety officials at the workplaces and the government agencies such as OSHA to help them understand the critical factors leading to accidents at the workplace sites.
Decision Executors
The results of the model, which are basically the predictions and explanations for potential severity level of accidents, would be relayed to the safety officials who monitor the day-to-day safety initiatives in the organization. These officials are the ones who have strong relationships with the different teams in the organization so as to ensure smooth implementation of safety measures across the organization. These officials also have the authority to take corrective actions as suggested by the model predictions.
Decision Managers
Decision managers are the executive stakeholders such as the OSHA agencies and organization heads (manufacturing heads, etc.) who will monitor and manage the safety program and analyze the performance of the measures put in place by the officials. These stakeholders are key to take strategic actions such as changes in the safety initiatives, since any kind of successful policy implementation has to come from the top down in an organization. Based on the overall results, these stakeholders can even perform a quarterly review of the health of the initiatives to help them take long term investment and business partnership decisions.
Decision Authors
Decision authors are the business analysts or data scientists who would build this decision environments. These analysts could be the engineers/analysts from the maintenance, engineering, or infrastructure teams in the organization that usually work collaboratively with the safety team of the workplace.
Decision Process
The decisions that the officials and executive stakeholders would take based on the predictions and explanations for potential severity level of accidents would enforce appropriate safety initiatives in the organization based on data driven intelligent insights.
The insights from the model help organizations make data-driven decisions to improve the safety measures and bring in new rules/systems accordingly or even alternative safety training for the workplace.
Model Monitoring
One of the most critical components in implementing an AI solution is having the ability to track the performance of the model for data drift and accuracy. With DataRobot MLOps, the organization can deploy, monitor, and manage all models across the organization through a centralized platform. This tracking of model health is very important for proper model life cycle management, similar to product life cycle management.
Getting early indications when model performance decreases is as key to the business as a good performing model; these help businesses avoid making incorrect decisions based on misleading or inaccurate predictions, which would then result in unnecessary efforts and the additional investment of resources for improving safety measures.
Implementation Risks
One of the major risks in implementing this solution in the real world is adoption at the ground level. The major challenge in implementing any safety measure is making sure it is followed by the workforce. Since an individual’s safety is in his/her own hands, the onus still lies with the safety officials. It’s really important for officials to get the different levels of the organization on board with this implementation because the solution helps not only the business but also the employees at a personal level. Strong channels of communication and effective training for the workforce enable you to take data-driven actions when needed, and help ensure continued adherence to the defined policies and measures.

Experience the DataRobot AI Platform
Less Friction, More AI. Get Started Today With a Free 30-Day Trial.
Sign Up for FreeExplore More Use Cases
-
ManufacturingPredict Whether a Parts Shortage Will Occur
Predict part shortages or late shipments in a supply chain network so that businesses can prepare for foreseeable delays and take data-driven corrective action
Learn More -
ManufacturingReduce Avoidable Returns
Predict which products will be returned and conduct a root cause analysis to prevent avoidable returns.
Learn More -
ManufacturingForecast Traffic Volume of Warehouse for Resource Planning
Forecast warehouse traffic to plan resources efficiently.
Learn More -
ManufacturingPredict Whether a Parts Failure Will Occur (Predictive Maintenance)
Using equipment sensor data, train a model to identify signals associated with an impending equipment failure so that preventative action can be taken.
Learn More


