

Reduce Patient Length of Stay
Overview
Business Problem
One of the primary predictors of cost for both healthcare organizations and patients is length of stay (LOS). Longer stays not only place patients at higher risk of hospital-acquired conditions, but they also constrain hospital bed availability and physician time.
Discharging a patient from a hospital, particularly after critical care, often requires significant care coordination and a complex administrative process. Healthcare staff may have to arrange post-discharge care, transfer to a specialized facility, clinician follow-up instructions, etc. By understanding the predicted length of stay ahead of time, healthcare staff can proactively create timelines for discharges and improve the coordination of their patients’ care.
Intelligent Solution
AI helps providers and payers predict the length of an inpatient stay at the time of admission. This gives healthcare organizations greater scheduling flexibility, reduces costs, and allows targeted interventions for at-risk patients.
Administrators can utilize LOS predictions to manage hospital bed utilization and avoid unnecessary patient transfers. AI enables operations staff to understand the predictors of excessive lengths of stay to improve discharge procedures by removing any administrative or care coordination barriers.
Clinicians in particular may analyze patients with high predicted LOS to look for abnormalities or medical risk factors that can supplement their medical judgement. Clinicians can also use LOS predictions to prioritize creating discharge instructions for those patients with shorter stays.
Value Estimation
What has ROI looked like for this use cases?
In general, we have seen DataRobot models reduce the average patient length of stay by 0.1 days without impacting quality of care.
For Steward health care, a large hospital network, this 0.1 day reduction in patient length of stay translated to savings of ~$1.25M across their 38 hospitals per year. For another organization, this same 0.1 day reduction translated to $10M in savings across the organization’s 8 hospitals. See their public reference here for more details.
How would I measure ROI for my use case?
ROI can be calculated based on multiplying the reduction in average length of stay times the average cost per day times the number of patients annualized. Note that the “cost” of a patient stay per day will vary dramatically based on the type of organization (payer vs. provider) and the type of reimbursement they receive (fee for service vs. value based).
Technical Implementation
About the Data
For illustrative purposes, this tutorial uses a synthetic dataset we created that replicates the data providers would typically have for this use case.
Problem Framing
The target for this guide, or feature we are predicting, is the length of stay in days.
In practice, it’s worth mentioning that the most important technical consideration is clearly defining the problem and subsequently which data to include. A typical length of stay model will predict at the time of admission how long a patient will remain in the facility until discharge. However, it may also be useful to create a prediction of how many additional days a patient will remain in a facility given their current length of stay.
To illustrate the difference, let’s assume a patient named James is admitted to the ICU after surgery. At the time of admission, we predict James will remain in the ICU for 10 days based on his initial diagnosis, treatment, any clinical notes, prior medical history, demographics, etc. However, after 3 days have elapsed we want to predict how many more days James will remain in the ICU. For this model we can include all the additional information gathered over the prior 3 days spent in the ICU, e.g.., vital signs, additional clinical notes, medications prescribed, lab test results, procedures, etc.
Here we will focus on the first type of modeling, i.e., predicting at the time of admission. The second type of modeling, i.e., predicting additional days given the current length of stay, is more complicated but certainly feasible.
DataRobot can automatically generate features based on linked datasets. Consequently we typically want at least two datasets. The primary dataset will have one row per patient. It will contain features such as the patient ID, target, various demographic information, and details about the current admission / medical episode.
The secondary dataset will contain observations over time about patients. Each row will therefore be a single patient observation at a point in time. This dataset will contain features such as the medical diagnosis at that time, active medications, vitals, etc.
Note: For the primary dataset, it is possible to have multiple rows per patient if the patient has had separate admissions. In that case, we will want to apply group partitioning in DataRobot to ensure all admissions for the same patient wind up in the same partition (see below).
Sample Feature List
Primary Dataset
| Feature Name | Data Type | Description | Data Source | Example |
|---|---|---|---|---|
| Patient ID | Categorical | Excluded from modeling, but necessary for linking results | EHR | MRN Number |
| Length of Stay | Numeric | Length of Stay for that patient in an admission | EHR | 5 |
| Admission Type | Categorical | What type of admission. | EHR | Emergency, Elective, etc. |
| Admission Source | Categorical | What department or intake | EHR | Surgery, ER, etc. |
| Payor Type | Categorical | What type of insurance or payment source | Billing | Medicare, Out of Pocket, etc. |
| Patient Age | Numeric | Age of Patient | EHR | 65 |
| Prior number of inpatient stays | Numeric | How many inpatient admissions this patient has had prior to the current admission | EHR | 10 |
| Average of Prior Length of Stays | Numeric | The average length of stays prior to the current admission | EHR | 6.8 |
Secondary Dataset
| Feature Name | Data Type | Description | Data Source | Example |
|---|---|---|---|---|
| Patient ID | Categorical | Excluded from modeling, but necessary for linking results | EHR | MRN Number |
| Observation Date | Date | When observation was taken | EHR | “2019-05-01” |
| Primary Diagnosis | Categorical | Diagnosis Code | EHR | ICD10 Code |
| Medications | Text | List of medications with spaces | EHR | “Insulin Statins” |
| Vitals (one feature or column per vital) | Numeric | Oxygen saturation, blood pressure, cholesterol | EHR |
Note: It may be helpful to create a third dataset that explicitly details prior admissions and length of stays rather than aggregating them into the primary dataset. This would enable DataRobot to automatically generate features such as max length of stay in the past year, average length of stay in the past year, time between current admission and last admission, etc.
Data Preparation
We generally want to include all data known about a patient at the time of admission. This would include information about the current medical episode, e.g., information from the emergency room, and any prior medical history. Since prior observations are longitudinal, i.e., a single patient will likely have multiple prior observations over a period of time, we will utilize DataRobot’s automated feature engineering to automatically generate trending, aggregated variables. One such automatically generated variable might be a count of all prior diagnosis codes over the past 6 months.
One aspect to consider is that patient data will likely come from an electronic health record (EHR) or the affiliated data warehouse. We will likely want a sufficient sample of historical data to make accurate predictions about future patients. Ideally this will be a sample of relatively recent data, i.e., in the past 1-2 years, since updated medical guidance, new treatment options, new procedures, etc. may alter the average length of stay over time.
To ensure we have a sufficient number of examples to capture the various reasons for admissions, e.g., different medical diagnoses, we will want a large number of historical patients (thousands to tens of thousands).
An important consideration with any healthcare dataset is personally identifiable healthcare information (PHI). Healthcare datasets are often anonymized by removing any personal identifiable references. The US provides HIPAA guidelines that outline what data elements are considered protected information. DataRobot offers two different deployment strategies based on the sensitivity of your data and the ability to anonymize it:
- For anonymous datasets or those without sensitive data, DataRobot provides a managed cloud offering that delivers our platform as a Software as a Service (SaaS).
- For sensitive datasets, we offer the ability to deploy DataRobot “on premise”, i.e., either on your own Linux cluster or a virtual private cloud (VPC) on the major cloud vendors.
With regards to the length of stay data, to use DataRobot’s managed cloud we would need to anonymize or remove attributes such as patient name, contact info, age, and other factors. The Center for Medicare and Medicaid Services (CMS) distributes an anonymized dataset of diabetic readmissions that provides a useful template.
As noted above, the historical training datasets can be extracted from a data warehouse. A key point is to ensure that all data is taken at or before the time of admission. We cannot include information we would not know at the time of the most recent admission. This is particularly important for any aggregated features such as prior number of inpatient stays, i.e., do not include the current inpatient stay in this average.
Model Training
DataRobot Automated Machine Learning automates many parts of the modeling pipeline. Instead of hand-coding and manually testing dozens of models to find the one that best fits your needs, DataRobot automatically runs dozens of models and finds the most accurate one for you, all in a matter of minutes. In addition to training the models, DataRobot automates other steps in the modeling process such as processing and partitioning the dataset.
A few notes for this use case:
We are going to model the time (LOS) in the hospital. First we upload the dataset, which in this case is a CSV file. Once the dataset is uploaded, we select our target, time_in_hospital. We are going to then select only the features, i.e., data elements, we would have at the time of admission and create a new feature list, length_of_stay_features. In this use case dataset, an anonymized diabetic readmissions dataset from CMS, we have information with high-level demographics on the patients, diagnosis information, payer information, number of prior inpatient / outpatient visits, medication information, diabetic lab values, etc.
Interpret Results
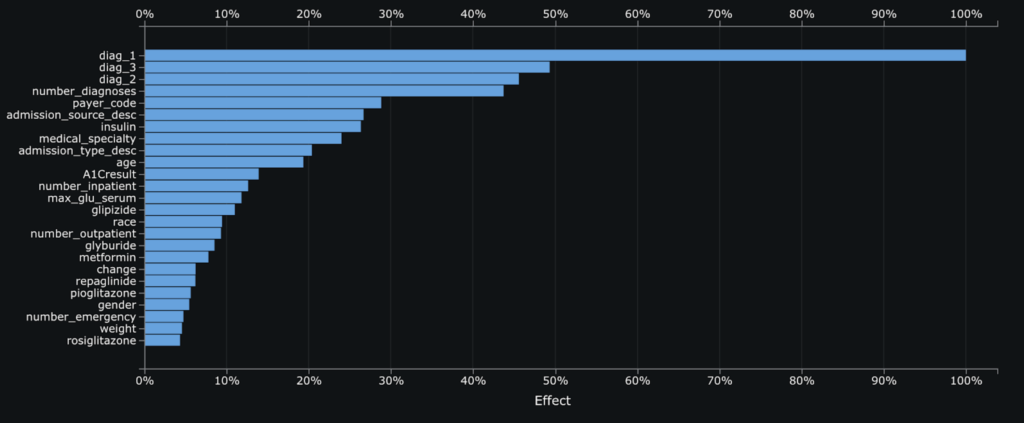
Feature Impact illustrates how much each feature matters to a particular model. For our top model, an XGBoost Regressor, we see that the primary, secondary, and tertiary diagnosis are the most important features followed by the number of prior diagnosis. This chart helps clinicians, operations staff, and other stakeholders start to understand what drives a higher or lower predicted LOS.
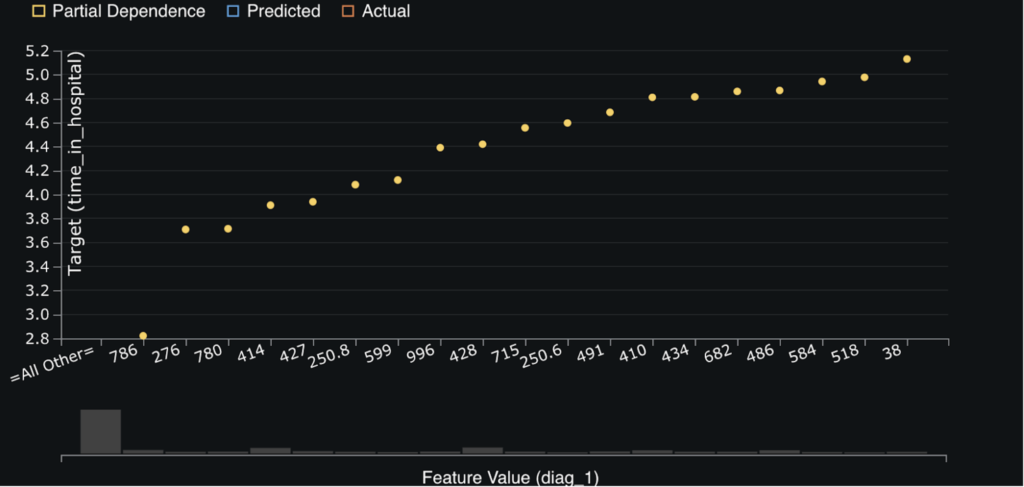
The next chart, Feature Effects, helps to dig deeper into the relationships between each feature above and the outcome, i.e., LOS. The goal of the feature effect chart is to help isolate the effect of each variable so that we can see trends in our dataset. For example, in the below chart we can see that ICD9 codes 38, Incision, Excision, And Occlusion Of Vessels, and 518, other diseases of lung, are correlated with higher LOS. Conversely, ICD9 code 786, symptoms involving respiratory system and other chest symptoms, is correlated with a lower LOS.
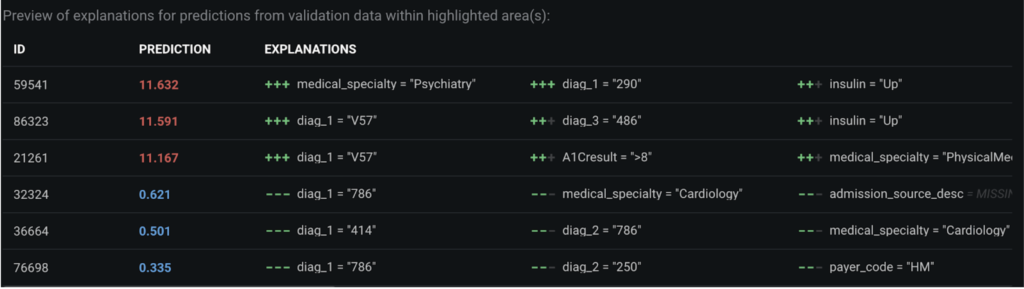
While this information is all very useful, we are still at the population level. Many clinicians or operations staff are interested in their particular patient. Luckily, DataRobot provides a way to view the top 10 reasons why a particular patient has a predicted LOS. For example, in the screenshot below we can see that the patient in the top row with ID 59541 has a predicted LOS of 11.632 days. The primary reason is because they were admitted to see a physiatry medical speciality while the second most important reason is that they have a primary diagnosis code of 290, dementia. Conversely, the patient in the bottom row with ID 76698 has a predicted LOS of only 0.335 days because they have a primary diagnosis code of 786, symptoms involving respiratory system and other chest symptoms, which may indicate they were simply experiencing shortness of breath.
DataRobot provides up to 10 reason codes for every patient in the training dataset and any new patients we make predictions about. We can export these Prediction Explanations into a wide variety of web applications and Business Intelligence tools. The second screenshot below shows the same dataset visualized in Power BI using the built-in DataRobot connector (although in that screenshot uses predicted readmission risk rather than LOS).
Evaluate Accuracy
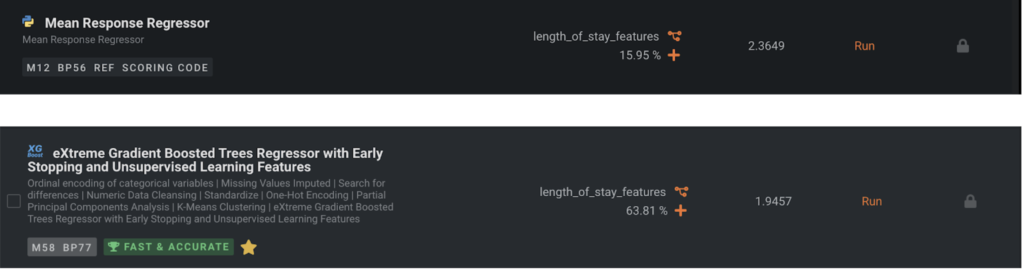
Now let’s make sure the baseline model is not near the top of the Leaderboard; when it is, it’s usually a sign that there is something wrong with the data prep or that there is little signal in the data. Since this is a regression problem, the baseline model is a Mean Response Regressor which always predicts the mean. We can see that our top model is more accurate on average by 0.4 days LOS than the Mean Response Regressor.
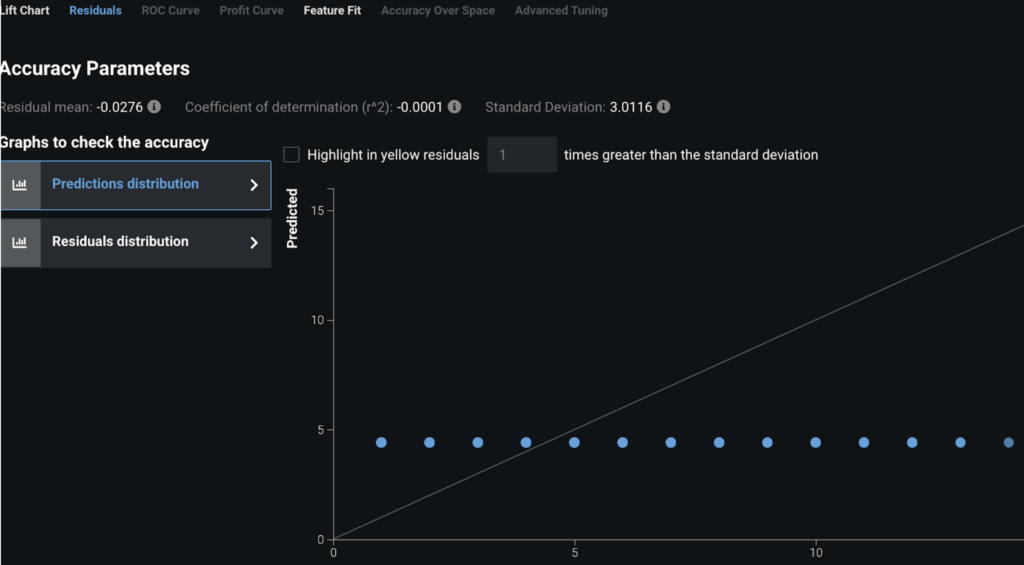
However, we dive a little deeper and look at the residuals plots to understand what is occurring. For the Mean Response Regressor, it is always predicting the same value for every point (the mean). Hence when we look at a chart of actual LOS vs. what the model predicted we see a straight line. In contrast, for our top model, eXtreme Gradient Boosted Trees (known as XGBoost), we see much more nuance:
Mean Response Regressor:
XGBoost:
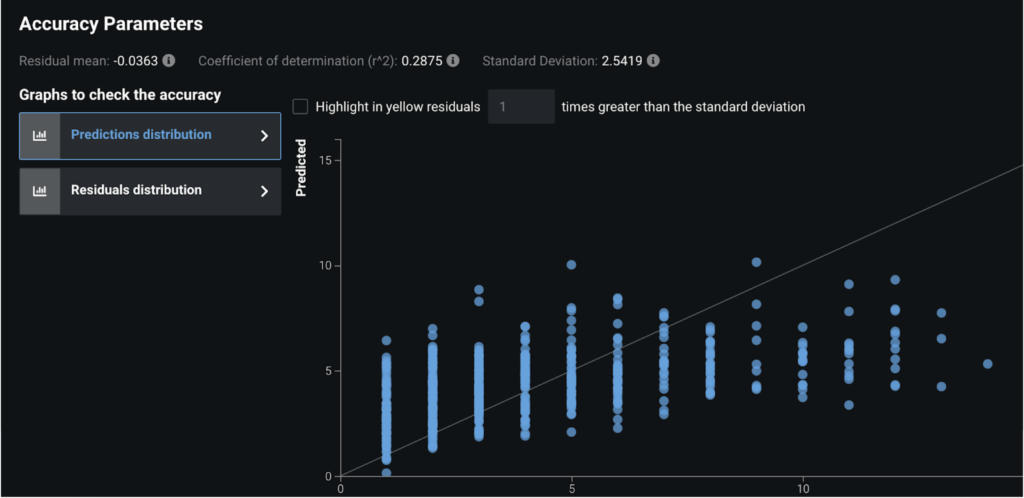
In the above XGBoost screenshot, the reason we see clearly separated vertical lines is because the LOS is actually an integer in this case, i.e., rounded to the number of days. This tells us that our model is still predicting a wide range of outcomes for each actual LOS value, e.g., we can see that when the LOS was actually 1 we predicted between 1 & 6 days in this chart.
These charts, and many others, help you understand at a nuanced level how your model predictions compare to the actual data. E.g., in the above XGBoost chart we can see that we never predict > ~10 days LOS for any patient, even when their LOS is actually >10 days. We may need to add in more patients to our dataset with high LOS to allow the model to learn and/or add more features to distinguish high/low LOS patients.
Post-Processing
Once you have an accurate model and you’ve interpreted it to validate that the predictive features (i.e., Feature Impact, Feature Effects, Prediction Explanations) are correct, then you can simply use the Predict tab to deploy the model. See the guide here for how to deploy a model.
Business Implementation
Decision Environment
After you are able to find the right model that best learns patterns in your data, DataRobot makes it easy to deploy the model into your desired decision environment. Decision environments are the ways in which the predictions generated by the model will be consumed by the appropriate stakeholders in your organization, and how these stakeholders will make decisions using the predictions to impact the overall process.
The most important aspect to consider up front is how the LOS predictions (and their associated insights) will be operationalized. Clinical staff face immense time pressure, particularly in hospitals, and so are often unable to incorporate another system into their daily workflow. For these users it is necessary to incorporate any predictions or insights into their existing workflow, e.g., an EHR template.
Administrative or operational staff may have more flexibility in their schedules. For these users it may be appropriate to surface insights into an operational dashboard such as a Business Intelligence (BI) tool.
Once an organization has decided which end users will consume the LOS predictions and the appropriate workflow, the next task is to design operational processes. For example, if a patient is predicted to have an excessive length of stay due to care coordination difficulties, which team should take responsibility to proactively address that issue? How does that team communicate?
Decision Maturity
Automation | Augmentation | Blend
Clinicians can generally provide an accurate and expert judgement on the likely length of stay based on medical factors. However, clinicians may not have insight into care coordination or other administrative blockers to discharge. The length of stay predictions and (more critically) the associated insights, are meant to augment clinical, administrative, and operational staff’s judgements at scale.
Machine learning models also have the advantage in that they can leverage patterns across a vast array of patients. Consequently they may add insights for patients with uncommon or novel admissions.
Model Deployment
As noted above, clinical staff will likely require these predictions and insights to be integrated into their existing clinical workflow templates in an EHR. Operational and administrative staff may prefer these predictions and insights to flow into either a BI tool or another healthcare system.
Decision Stakeholders
Decision Executors
Discharge planning administrators, clinicians, and operations staff. Administrators and clinicians will likely focus on a case-by-case basis while operations staff will focus on broader patterns to streamline processes.
Decision Managers
Senior clinicians and operational managers.
Decision Authors
Senior clinicians and operational leaders. A key area of discussion will be ensuring that any insights or predictions do not compromise clinical care. The goal is to improve efficiency and remove unnecessary administrative barriers to discharge.
Decision Process
First, clinicians can use the insights and predictions to double-check for abnormal or overlooked medical risk factors. If there is a discrepancy between a clinician’s medical judgement about the likely LOS vs. the model’s prediction, they can introspect the model to see what is driving the prediction and if there is an obvious issue. For example, if the clinician sees a high predicted LOS for a relatively simple patient they may investigate to see if there are any complications the model has surfaced. Conversely if they see a low predicted LOS for a complex patient they may investigate to see what makes this patient different so as to skew the model’s predictions (e.g., a rare medical condition not present in the training data). The clinician can also use the model’s LOS predictions to align care teams around discharge planning and prioritize the patients who are likely to leave the hospital quickly.
Operational staff can utilize the LOS predictions to understand future bed utilization and handle capacity issues (e.g., avoiding patient transfers between facilities). Bed utilization is a key metric for most healthcare facilities and has a direct quality of care and financial impact. Operational staff can also examine predictors of high lengths of stay to refine processes to avoid unnecessary administrative / care coordination blockers to discharge.
Administrative and clinical staff may proactively work on discharge planning for those individuals with excessive predicted length of stays. They can also provide timelines to downstream care providers, e.g., skilled nursing facilities, to ensure a prompt discharge.
Care managers at payers can utilize LOS predictions to guide care planning and utilization management. Patients with high-predicted LOS may require extensive follow-up care and so care managers can proactively align resources that provide high quality services at reasonable cost.
Model Monitoring
Models should be tracked by evaluating data drift, but with these models there is often a human-in-the-loop in terms of understanding if there are any systemic changes in the environment that require significant changes to the model or more manual intervention. For example, a novel new disease like Covid-19 may skew length of stay calculations until sufficient new data has been gathered.
Implementation Risks
Healthcare data is complex. Patients receive care from multiple organizations over time and it is often difficult to create a unified medical history, particularly in the United States. Machine learning models rely upon accurate data to produce accurate insights. It is critical to ensure that the machine learning training data accurately reflects patients’ medical history. At prediction or scoring time for new patients, it is equally important to include accurate and up-to-date information about that patient. Another subtle issue is to ensure that the training data is representative of the patient population about which the model is expected to make future predictions; e.g., a model trained on older patients suffering mainly from chronic conditions that is used to predict LOS for younger patients suffering from traumatic injuries will produce inaccurate predictions. DataRobot provides the ability to monitor and manage this data drift and automatically provide notifications.
From a stakeholder point of view, clinicians often suffer from “tool fatigue” and more general burnout due to workloads. They often have neither the time nor motivation to learn a new workflow or tool. Any implementation must avoid burdening clinicians further and instead immediately improve their daily routines.
More broadly, organizations need to carefully consider their problem framing and avoid any impact to patient care. Any AI recommendations, regardless of how sophisticated, should be viewed as supplemental to human judgement for critical activities.

Experience the DataRobot AI Platform
Less Friction, More AI. Get Started Today With a Free 30-Day Trial.
Sign Up for Free
Explore More Use Cases
-
HealthcareImprove Patient Satisfaction Scores
Increase patient satisfaction scores by predicting which patients are likely to submit poor scores and the primary reasons. Design interventions to improve their satisfaction.
Learn More -
HealthcarePredict Suicide Warning Signs
Provide a supplementary assessment that helps prevent suicides and save lives by predicting ahead of time who is likely to commit suicide.
Learn More -
HealthcarePredict Which Patients Will Admit
Predict which patients are likely to be admitted to proactively improve their health.
Learn More -
HealthcarePredict Outpatient Appointment No Shows
Predict in advance which patients are likely to miss their appointments to reduce clinician downtime.
Learn More