

Predict JIRA Completion ETA
Overview
Business Problem
JIRA is the most common tool for collaboratively planning, tracking, and fixing code issues in agile software development teams. JIRA is used by companies of all sizes—small, medium, and large.
When organizations decide to prioritize building a new product or feature, or fixing a bug, there is always a phase of planning that goes into this process. Project Managers will work with the business stakeholders to define and scope the software build. They will document the necessary deliverables and determine how much time they expect the development to take, as well as how many developer resources are needed—this information is used to build in the expected time frame. Small projects can take as little as a couple weeks, but large projects can take many months or years if there is a high degree of complexity.
If all projects were completed in the estimated amount of time with the exact number of developers that were planned for then there would be no value in building a model to predict the number of days left as there is no quantifiable error. However, this is almost never the case. There is always an error in projects going long and needing extra resources to complete on time. Even more costly is when projects fall behind and extra resources are needed to ensure the project completes on time.
The business problem that we are solving is in this common divergence of time allotted for a project and the actual time that is needed.
Intelligent Solution
AI can help with this problem by predicting how long every project in the future will take to complete. AI models can do so by learning from all the previously completed projects, leveraging information on the types of projects, the magnitude of the projects, and how many days each of those historical projects took to complete.
The value here is twofold:
- We can use the model at the start of the project to predict more accurately how long it will take to complete.
- We can make predictions at different points of the project’s lifecycle to predict when it should be completed (number of days).
Value Estimation
How would I measure ROI for my use case?
- Calculate the existing cost of current operations around JIRA processing
- How many project initiatives, epics, stories were completed in the past 3 or 5 years?
- How many project initiatives, epics, stories were completed after the expected completion date?
- What was the cost of these projects that went beyond the expected completion date (Typically, there is a cost in time and cost in adding more developers to the project)?
- Calculate the uplift if using a model to predict completion time reduced the number of times that projects went longer than expected
- If a model’s predictions can help make more accurate estimates of the length a project will take to complete or reduce the number of overdue projects by 10%, we can multiply this 10% with the dollar amount from Step C above
Technical Implementation
Problem Framing
JIRA users are familiar with the view of the platform where users can input and maintain their projects/tasks. With all the pieces here, there are a few different ways we can frame the use case of predicting project completion time; although these can be as complex or simple as desired, going the extra mile will make this use case much more robust.
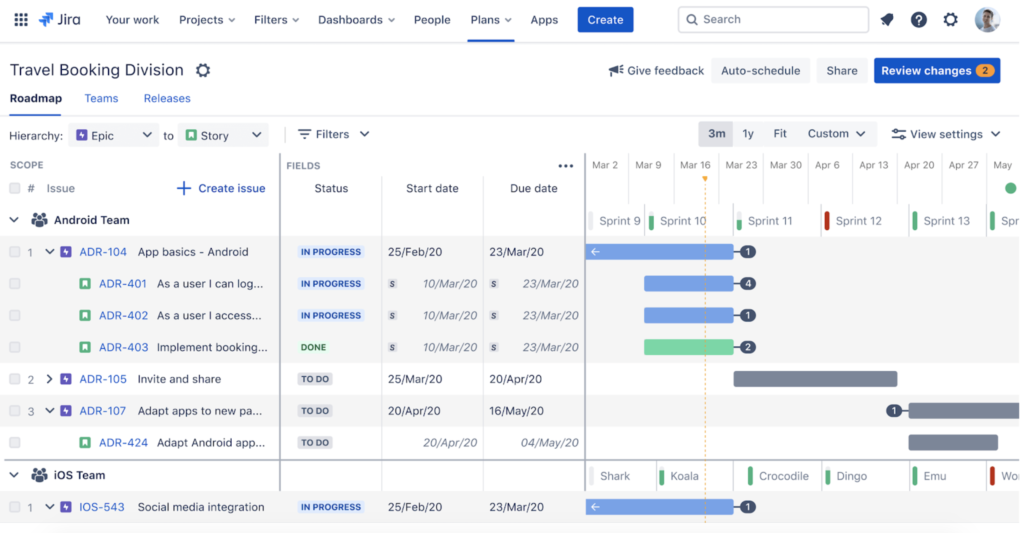
Source: https://www.atlassian.com/software/jira
The first thing to discuss is that JIRA operates as a hierarchy—generally something like Themes > Initiatives > Epics > Stories > Subtasks. We need to think about which hierarchical level we want to model at. For example, we wouldn’t include a row for each Initiative, each Epic, and each Story all in the same dataset. Instead, we need all rows to be in the same “unit of analysis,” meaning that all rows should reflect details at the same granularity.
Whether each row represents Epics or Stories does not matter, but we want to ensure the unit is in the same granularity that we care about (again, we shouldn’t represent rows as Epics if we care about how long a Story will take to close). So we first need to ensure that all the data is in the same unit, then we can move on to the next task: determing which unit is best.
There is no “best hierarchical level” for predicting; instead, it is usually a matter of how much data we can use to train the model. Because of the nature of hierarchies, there are many more Stories than there are Initiatives as it is typically true that the smaller the granularity, the more observations (i.e., 1 Month = 30 Days → “Let’s model for days so we have more observations!”). We should start where we know there is enough data, typically at least a few thousands records. For this guide, we will model for Epics.
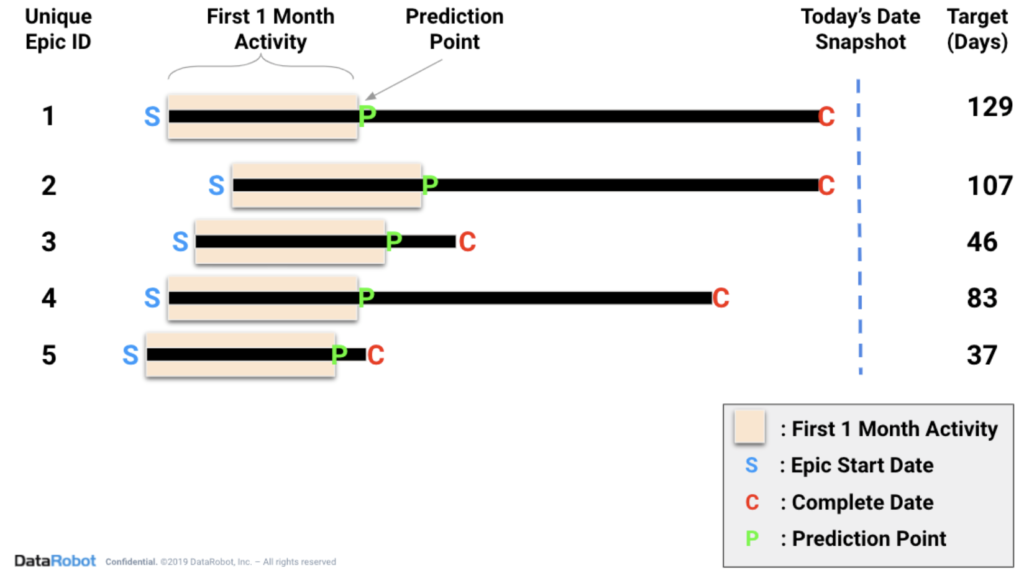
An example below illustrates this point where the model will be trained using the first 30 days of activity after the start date of the Epic. Historical Epics will be used as the rows of data, and all of the events/information that occur in the first 30 days will be used to populate the dataset. In production (the real world), the model will be used to make predictions on the 31st day.
Next we need to determine the prediction point, or the point in time when we will want to make predictions during production. We need to determine where this point will be in the Epic lifecycle so that this model’s predictions are useful and still capture a good amount of data. Some considerations:
- If we make it too early (e.g., at the Epic start date), there might not be much information about the Epic to make an accurate prediction.
- If we make it too late (e.g., 12 months after the Epic start date), there might be little value because very few Epics last this long.
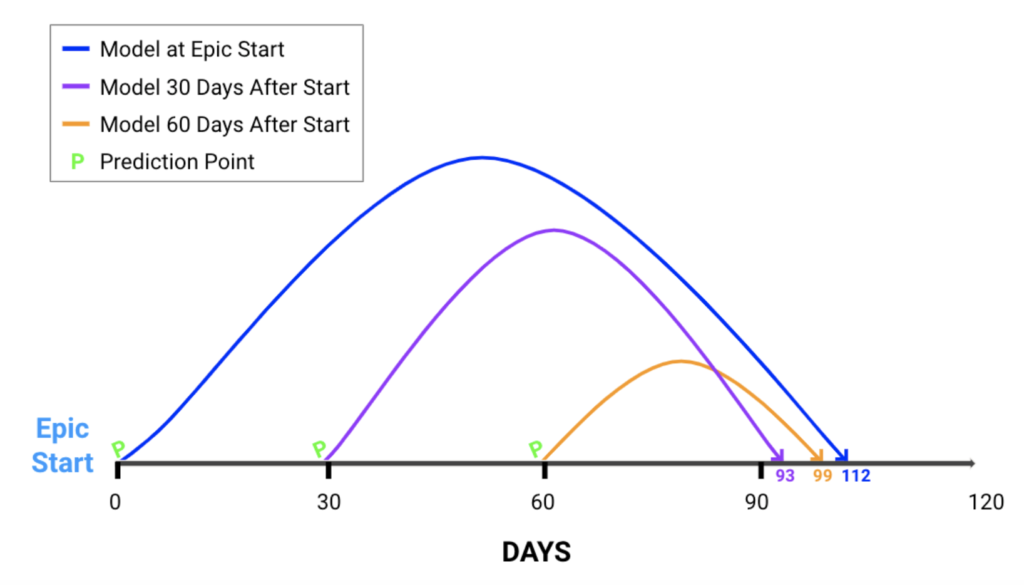
Ultimately, it’s a good idea to train multiple models at different points in time for robustness. The illustration below shows how we might use three different models in time for production to predict the final end date.
Please Note: When training a model to use after n days post start date, do NOT include historical data that completed under that same n number of days. All historical observations used for training should be longer (in duration) than the model’s intended usage after the Epic start. For example, if we want to use our model to make predictions on the 60th day of the Epic, we will want to train the model using historical observations that were longer than 60 days.
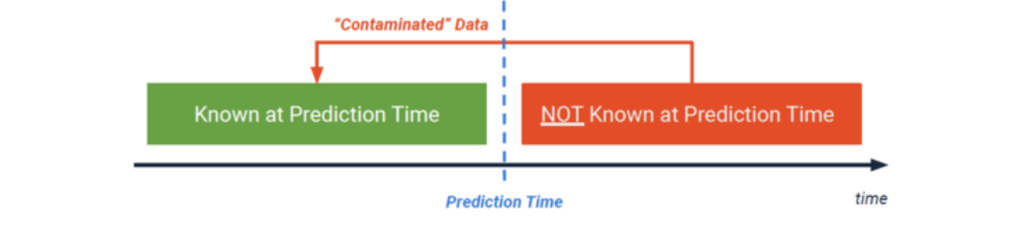
The last item of attention relates to the previous paragraph: once we know that we will run a model after a certain period of time for our prediction point, we need to ensure NO DATA (other than the target variable) comes from after that prediction point. Including data from after the prediction point could result in target leakage. The below illustration shows that we should only be using data prior to the prediction point in our dataset. Every new piece of information that comes after the prediction point cannot be used in training the model. As such, it’s important to use multiple models with different prediction points (e.g., prediction point at start of Epic, prediction point 1 month into Epic, prediction point at 6 months into Epic, etc). For this guide, we will use a prediction point of 1 month after the Epic start date.
Data Preparation
As mentioned above, in this guide we will assume that we are modeling for Epics and predict how many days each will take to complete after the first 30 days of activity. So the next step is to make a query from JIRA that will allow us to structure the data to solve this problem.
Here we will not show any actual data but will describe the features that might be relevant if you were to create a dataset with your organization’s JIRA-generated data.
While a majority of the features come directly from JIRA, some feature engineering is needed to generate new information which should help the model find more signal in the data. For instance, the dates coming from JIRA will need to be converted to days.
We want to include all the possible information regarding the Project, Epic, Stories, etc. Any piece of data that might carry some information could potentially be useful and we should include it. If there are additional systems used in your organization that describe these Projects, Epics, Stories, etc, feel free to join their data with the data from JIRA.
Sample Feature List
| Feature Name | Data Type | Description | Data Source | Example |
| TARGET | Integer | Days the Epic actually took to complete | JIRA | 57 |
| Epic_ID | Categorical | Reference / Primary Key | JIRA | 21 |
| Epic_Name | Text | Name of Epic | JIRA | Link to Parent |
| Project_ID | Categorical | ID of parent Project | JIRA | 77345 |
| LOB | Categorical | Name of Line of Business the epic is being developed for | JIRA | Finance |
| Department | Categorical | Name of Department the Epic is being developed for | JIRA | Forecasting |
| Complexity Estimate | Categorical | Estimate of Epic complexity from PMs and Devs | Human Input | High Complexity |
| Time Estimate (Days) | Integer | Number of days expected for build | JIRA | 48 |
| Hours Spent (30 days) | Integer | Sum of hours spent so far in the first 30 days of activity | JIRA | 180 |
| # of Stories | Integer | Sum of Stories included in this Epic hierarchy | JIRA | 27 |
| # of Story Changes | Integer | Sum of the number of Story changes/amendments | JIRA | 18 |
| # of Developers | Integer | Total number of software developers on Epic | JIRA | 3 |
| # of Status Changes | Integer | Total number of Status changes | JIRA | 7 |
Model Training
DataRobot Automated Machine Learning automates many parts of the modeling pipeline. Instead of hand-coding and manually testing dozens of models to find the one that best fits your needs, DataRobot automatically runs dozens of models and finds the most accurate one for you, all in a matter of minutes. In addition to training the models, DataRobot automates other steps in the modeling process such as processing and partitioning the dataset.
While we will jump straight to post processing the model predictions and deploying the model, you can take a look here to see how DataRobot works from start to finish and to understand the data science methodologies embedded in its automation.
Post-Processing
Common post processing needed for this use case is to compare the predicted number of days to the number of days initially expected by the Project Managers. The model will output a continuous number such as “57” representing 57 days until completion. We would want to add this predicted number of days to the date of the prediction point to determine the model’s expected date of completion.
Example
- Epic Start Date → 3/21/2020
- Project Manager’s Expected Completion Date → 7/7/2020
- Model’s Prediction at 30-day Prediction Point → 89 days
- Model’s Predicted Completion Date → 89 + 4/21/2020 = 7/19/2020
Comparing the PM Expected date of 7/7/2020 versus the Model’s Expected date of 7/19/2020 shows the model thinks we are behind and will complete 12 days later than initially expected.
In practice, it is also often desirable to include the Prediction Explanations from DataRobot, which show the top statistical drivers behind each project’s predicted completion time. Many times, individuals who are not trained in data science do not understand how a prediction is generated and will often not trust the prediction. Prediction Explanations help ensure we are providing individuals consuming the model predictions with the most context possible to help them develop constructive prevention strategies.
Business Implementation
Decision Environment
After you finalize a model, DataRobot makes it easy to deploy the model into your desired decision environment. Decision environments are the methods by which predictions will ultimately be used for decision making.
Decision Maturity
Automation | Augmentation | Blend
The predictions will help to give data-driven insight to the Project Managers and Developer teams as to the length of a given Epic as well as what is driving the predicted value. This information will help decision makers determine if more developers are needed on an Epic to ensure it finishes on time.
Model Deployment
We will want to write the predictions back to the original dataset so that we can use this data in the future for re-training our model with more data. We will want to write the actual completion number of days for all Epics to this same table.
Additionally, we will want to integrate the model predictions into the JIRA application through their widgets. An ideal solution is to display the predicted end date in JIRA as well as the Prediction Explanations alongside. If other dashboards are used by Project Management, we would look to integrate with those dashboards as well.
Decision Stakeholders
Decision Executors
Project managers will use the predictions to ensure project status is on track from a timing perspective. If the project is predicted to take more days than expected, it can be a cost saving to shuffle more developers to get the project back on track before too much time elapses.
Decision Managers
Directors of engineering will have oversight on their project managers and will be able to make decisions on which projects they should add resources to.
Decision Authors
Data scientists, HR analysts, and industrial/organizational psychologists are all well-positioned to build the models in DataRobot. IT support or vendors can be brought in if there are particular data processing challenges (e.g., PDFs).
Decision Process
- Will help to make a more informed initial determination of the expected number of days to complete.
- Using multiple models at different distances from the start date, we will be able to determine if an Epic is behind or ahead of schedule.
- If projects are behind schedule, Project Managers will be able to make decisions earlier if more resources are needed.
Model Monitoring
Models should be retrained when data drift tracking shows significant deviations between the scoring and training data. In addition, it is not uncommon for new fields to be added or changed inside the JIRA tool. Models may need to be refreshed if highly predictive features are not used anymore in JIRA, or if new features are added.
Finally, think carefully about how to evaluate model accuracy. Depending on the distribution of our target variable, we might want to use RMSE, MAE, or a deviance metric to best evaluate the performance of our model. We will certainly want to track this accuracy over time to understand how our model’s accuracy changes over time. If the model accuracy is decaying to an unsatisfactory degree, we will most certainly want to retrain the model.
Implementation Risks
Considering that “all models are wrong but some are useful” (as famously quoted by British statistician George Box), we want to ensure that we are not implementing bad models. A bad model would be one in which the model prediction errors are beyond an acceptable range.
It’s certainly possible that the model predicts an Epic to complete in 65 days, but was initially expected to complete in 50 days. As such, more developer resources may be added by the Project Manager to ensure timely completion of the Epic. If the model was over-predicted by 20 days, and the Epic would have been completed on day 45 (early), but we still brought more resources to the Epic, we wasted money and resources pooling developers when it was not necessary. It’s important to understand the cost of the model if it under- or over-predicts.

Experience the DataRobot AI Platform
Less Friction, More AI. Get Started Today With a Free 30-Day Trial.
Sign Up for Free
Explore More Use Cases
-
TechnologyPredict Next CRM State to Inform Marketing
Predict which of your prospects will advance along your sales pipeline.
Learn More -
TechnologyMaximize Freemium Subscriber Conversion
Predict which free trial customers are likely to continue or cancel their subscription to a service at the end of their trial period and the key drivers of conversion and churn.
Learn More -
TechnologyMaximize Survey Response Rates
Predicting the likelihood that an individual recipient will respond to a survey.
Learn More -
TechnologyIdentify Anomalous Product Postings
Flag fraudulent and anomalous accounts or product postings.
Learn More