

Predict Customer Lifetime Value (CLV)
Overview
Business Problem
In a variety of situations—marketing, refunds, returns, and loyalty programs—there is an implicit assumption that there is a future value associated with a customer. However, in many cases, this future value is entirely unquantified and so there is significant uncertainty associated with decisions, such as how large a discount should be offered, how many returns should the business allow, and whether loyalty points be allowed to expire. In reality, most customers are likely not valuable as commonly expressed by the Pareto Principle that 20% of customers account for 80% of revenue. By understanding which customers are the most valuable, a retailer can invest the right resources to ensure long term success.
Intelligent Solution
Retailers may already use data-driven approaches to segment customers and identify characteristics or demographics that lead to higher overall value. With machine learning, a much more granular approach can be taken to estimate the future value of specific, individual customers. This number can then be fed into decision making at a personalized level to ensure that short term costs are balanced against the value of a long term relationship.
Value Estimation
How would I measure ROI for my use case?
Truly measuring the effectiveness of lifetime value models requires some experimentation. This may involve setting aside a control group where all customers are treated as previously without taking into account future value, and a treatment group using lifetime value predictions in decisions. However, if you have enough variation in historical data, you can estimate how effective it may have been in past interactions. This is typically associated with acquiring new customers or preventing the churn of existing customers.
As a simplified example, take a historical campaign that offers discounts to new customers. You can build models for lifetime value, as well as conversion rate, and then optimize your historical discounting to maximize the expected value.
Actual value = Sum of profit since the campaign for acquired customers – Cost of original discounts
Estimated value = (Estimated CLV since campaign x Expected conversion rate) – Cost of optimized discounts
Potential ROI = Estimated value – Actual value
A simpler alternative approach would be to assume a roughly similar conversion or retention rate. For example, we may want to use CLV to prioritize the customers to retain, in order to make retention activities more profitable.
Potential ROI = (Average customer revenue using CLV – Average customer revenue without CLV) x Number of churns prevented
Technical Implementation
About the Data
For illustrative purposes, this tutorial leverages a dataset on household-level retail transactions across 2 years for 2500 households (this dataset is publicly available on Kaggle). Information is also provided on household demographics, product information, and marketing campaigns. For the purpose of predicting customer value, the marketing information will not be used in this tutorial.
In practice, while the ideal goal would be to estimate the entire lifetime value of a customer, for most companies this is impractical. From a data perspective, capturing the entirety of a customer’s lifetime value requires having enough historical examples of customers who have permanently stopped all interactions.
Instead of using total value, which is often unobserved, machine learning approaches generally look to predict how much a customer is worth over a specific period of time. For example, you will likely want to know how much a customer will be worth over the next 6 months, 1 year, or 3 years. The tradeoff between the length of time depends on how long-term your decision making has to be for your business, as well as how much historical data exists. The time frame does not need to be the same across all customers, as long as you can specify a start and end window for all of your historical data.
Problem Framing
Notice that the raw datasets only contain information about demographics, products, and historical transactions; this is likely to be familiar to most retail companies. However, to make this ready for machine learning, we first need to define a target to predict. In this case, we want a number as our target, Future Value, which means we have a regression problem.
Because we want to predict the future value of a customer at a point in time, in our historical training data we will want to have many snapshots of each individual. As such a script would take historical transactions, and then for each customer:
- Creates up to 10 snapshots at different points in time
- Identifies total sales value in the following 26 weeks for each point in time
- Assigns Future Value as the target for each snapshot
To help our model learn, we also want to include information about past transactional activity for each customer. We recommend including any features you and your business experts would consider important in understanding the value of a customer.
Sample Feature List
The intention here is to give ideas of what a final dataset may look like; the example dataset does not include all of the following.
| Feature Name | Data Type | Description | Data Source | Example |
|---|---|---|---|---|
| Future Value | Numeric | Customer value in subsequent 6 months, this is the target to predict | Transactions | 872 |
| Snapshot Timestamp | Datetime | Snapshot of customer from which we want to predict forwards | Transactions | 2019-01-01 |
| Household ID | Categorical | Unique identifier for customer household | Loyalty data | abc123 |
| Age | Numeric | Customer age | Loyalty data | 30 |
| Postcode | Categorical | Customer postal or zip code | Loyalty or shipping data | 12345 |
| Gender | Categorical | Customer gender | Loyalty data | F |
| Household size | Numeric | Size of family household | Loyalty data | 4 |
| Tenure | Numeric | Length of relationship with customer in months | Loyalty data | 6 |
| NPS score | Numeric | NPS scores submitted in the past | Post-order survey | 8 |
| Feedback | Text | Direct commentary | Post-order survey | Very fast delivery! |
| Transaction frequency (month) | Numeric | Number of transactions in last month | Transactions | 4 |
| Transaction frequency (year) | Numeric | Number of transactions in last year | Transactions | 42 |
| Maximum transaction size | Numeric | Largest single transaction amount | Transactions | 187.99 |
| Total transaction amount in last year | Numeric | Sum of all transaction amounts in the previous year | Transactions | 1982.01 |
| Categories of purchases | Summarized Categorical | Breakdown of transaction categories | Transactions | Groceries: 50%
Clothing: 30% Electronics: 20% |
Feature Discovery
Rather than manually aggregating the transaction dataset at the level of our snapshots, we’ll use automation to speed things up. DataRobot’s Feature Discovery can easily and automatically help with aggregating and generating features relating to other sources of data.
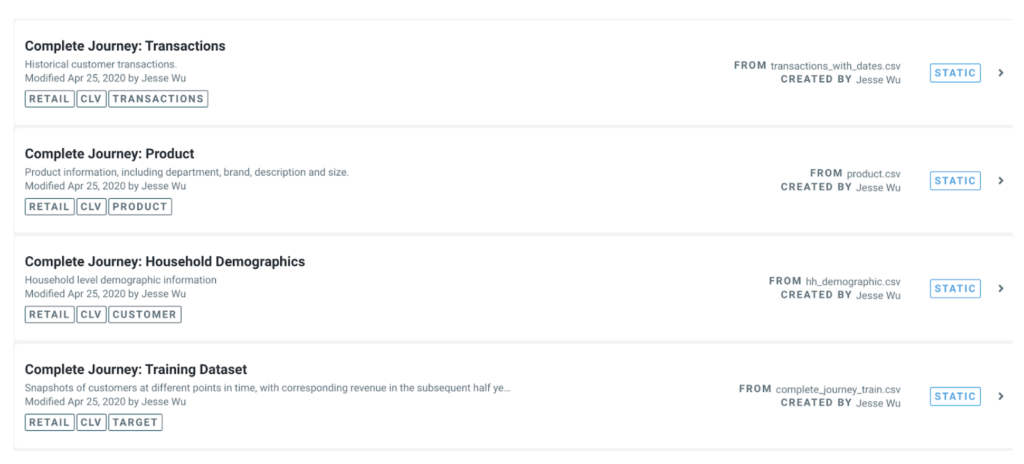
To start, we’ll upload all of our data into the AI Catalog:
We can then define the relationships between each of these datasets, and so include our additional sources of information in automated feature discovery prior to modeling:
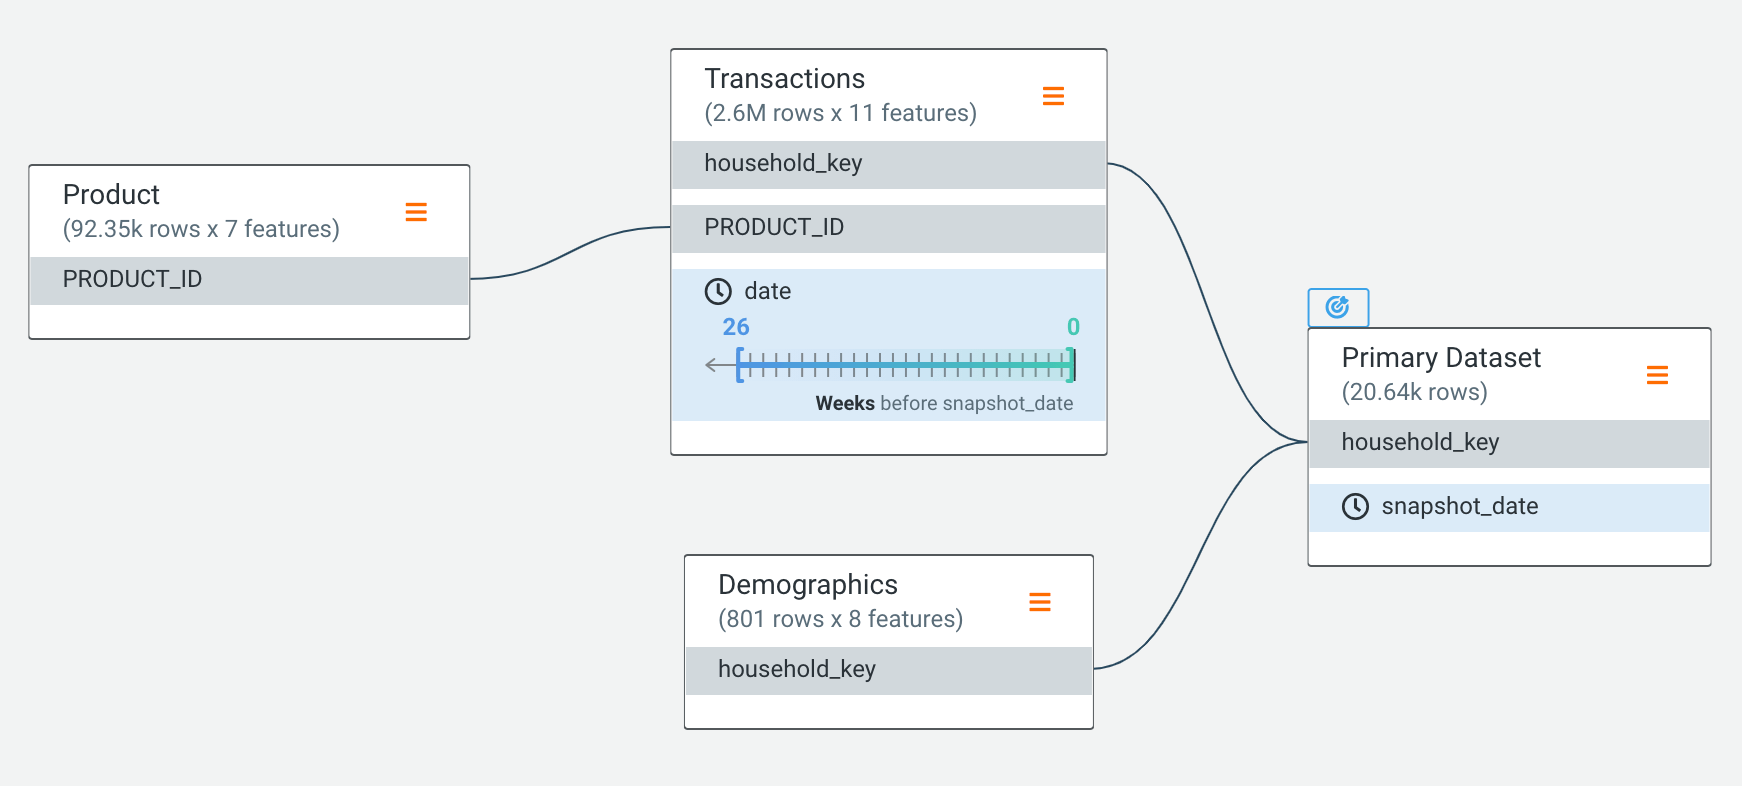
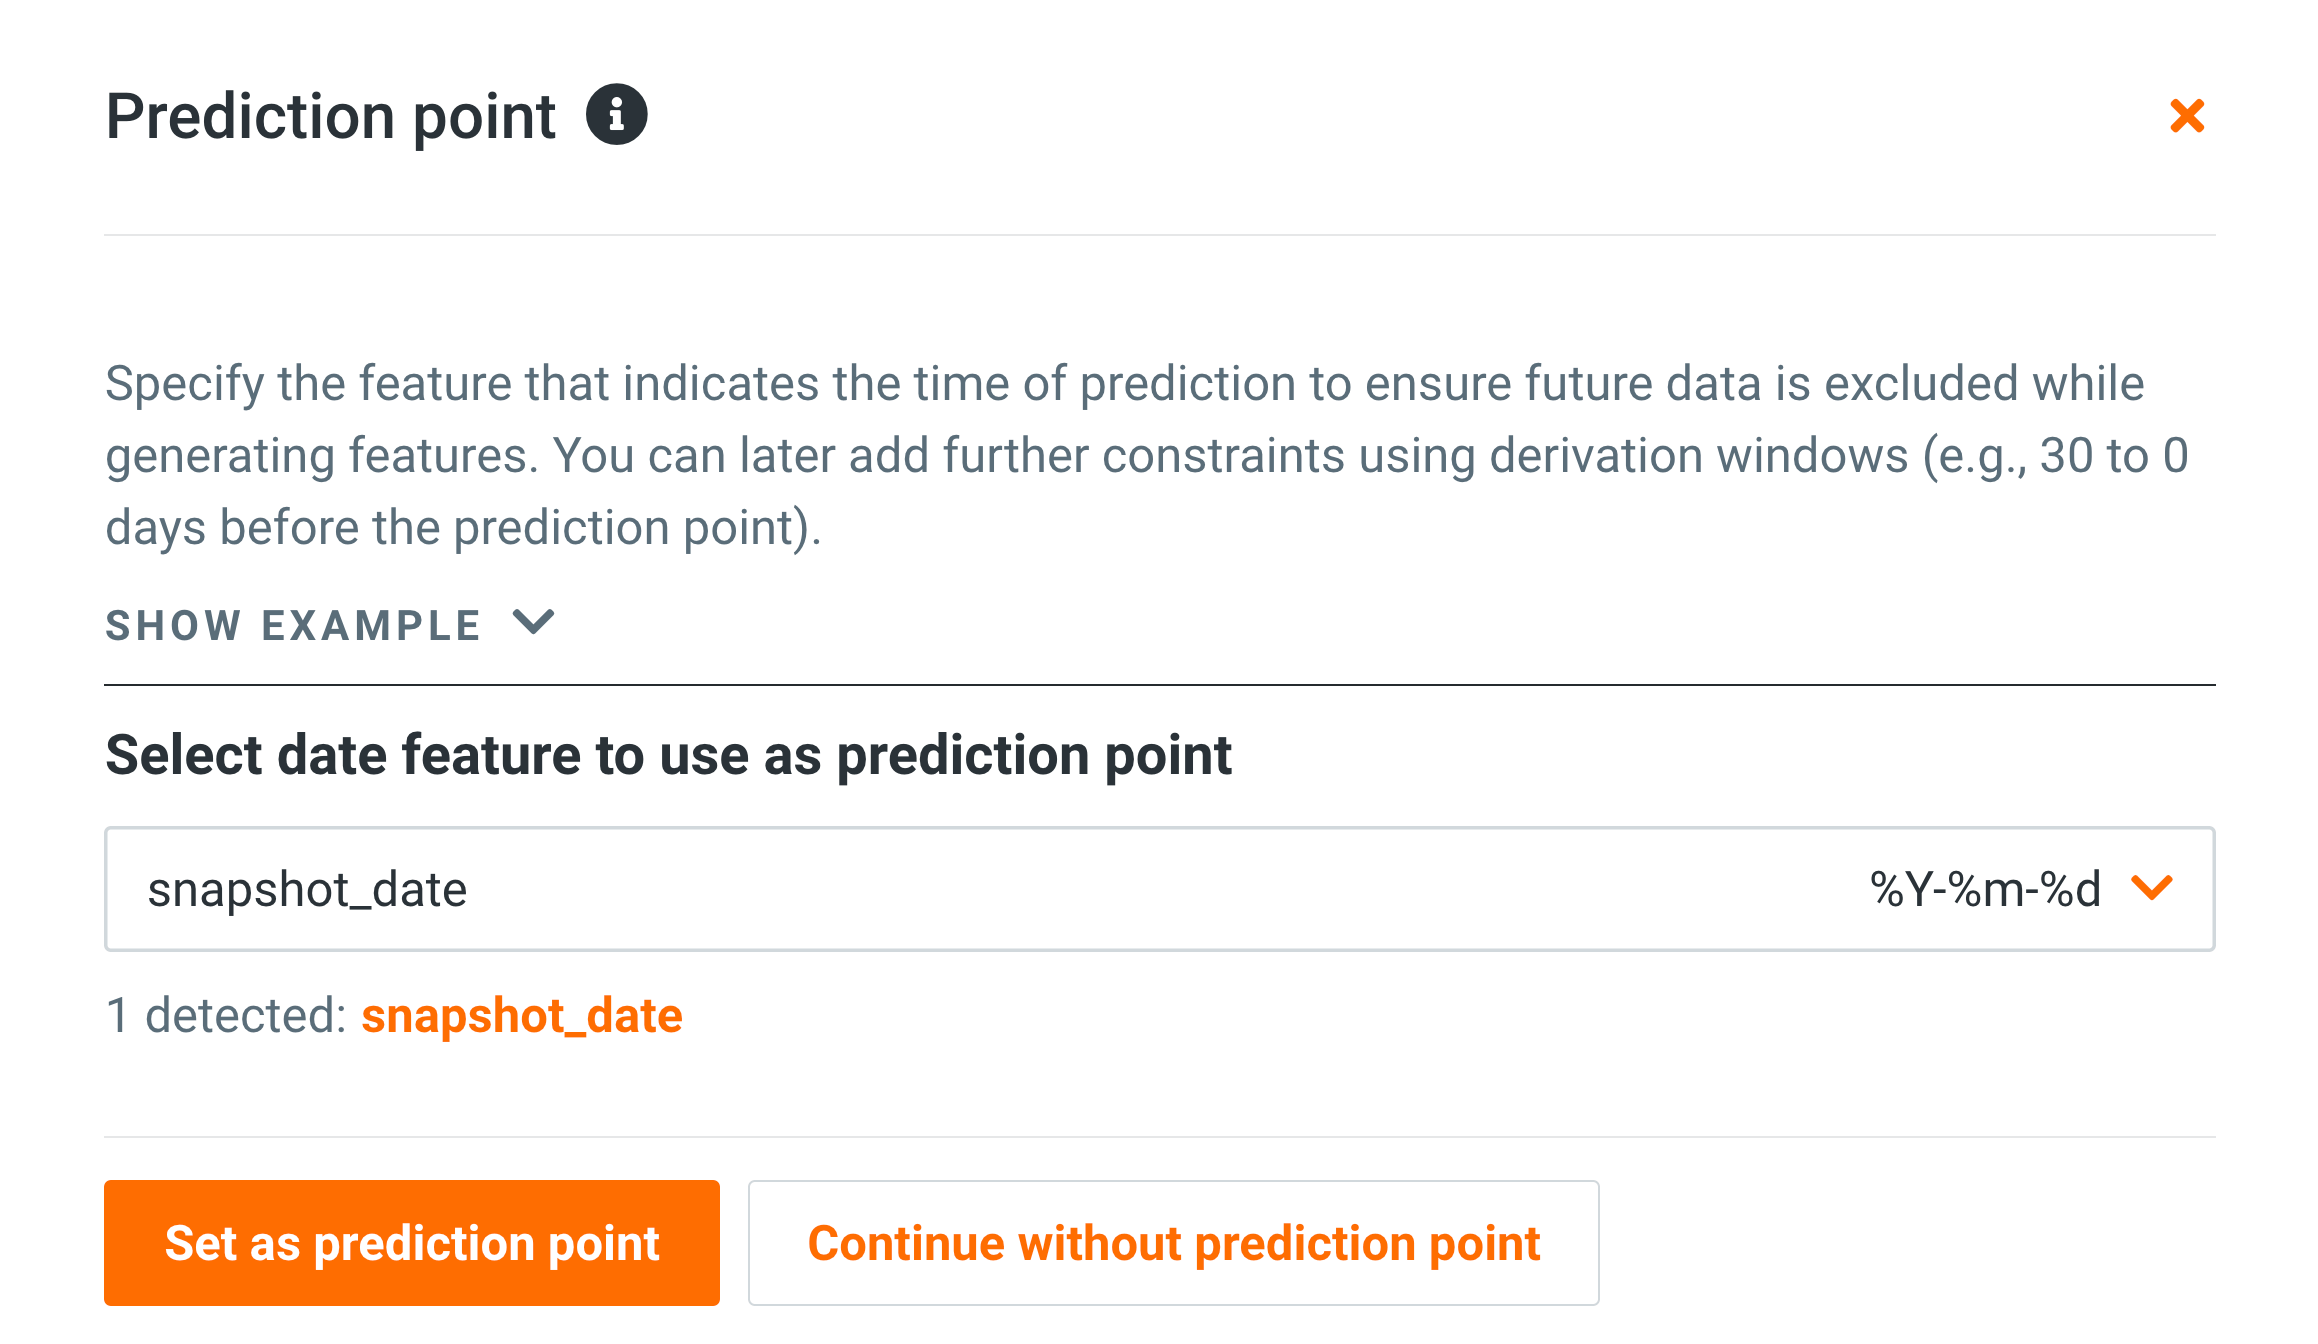
Note that we want to make sure only transactions that occurred (in the 26 weeks) prior to a snapshot are included in the feature engineering process:
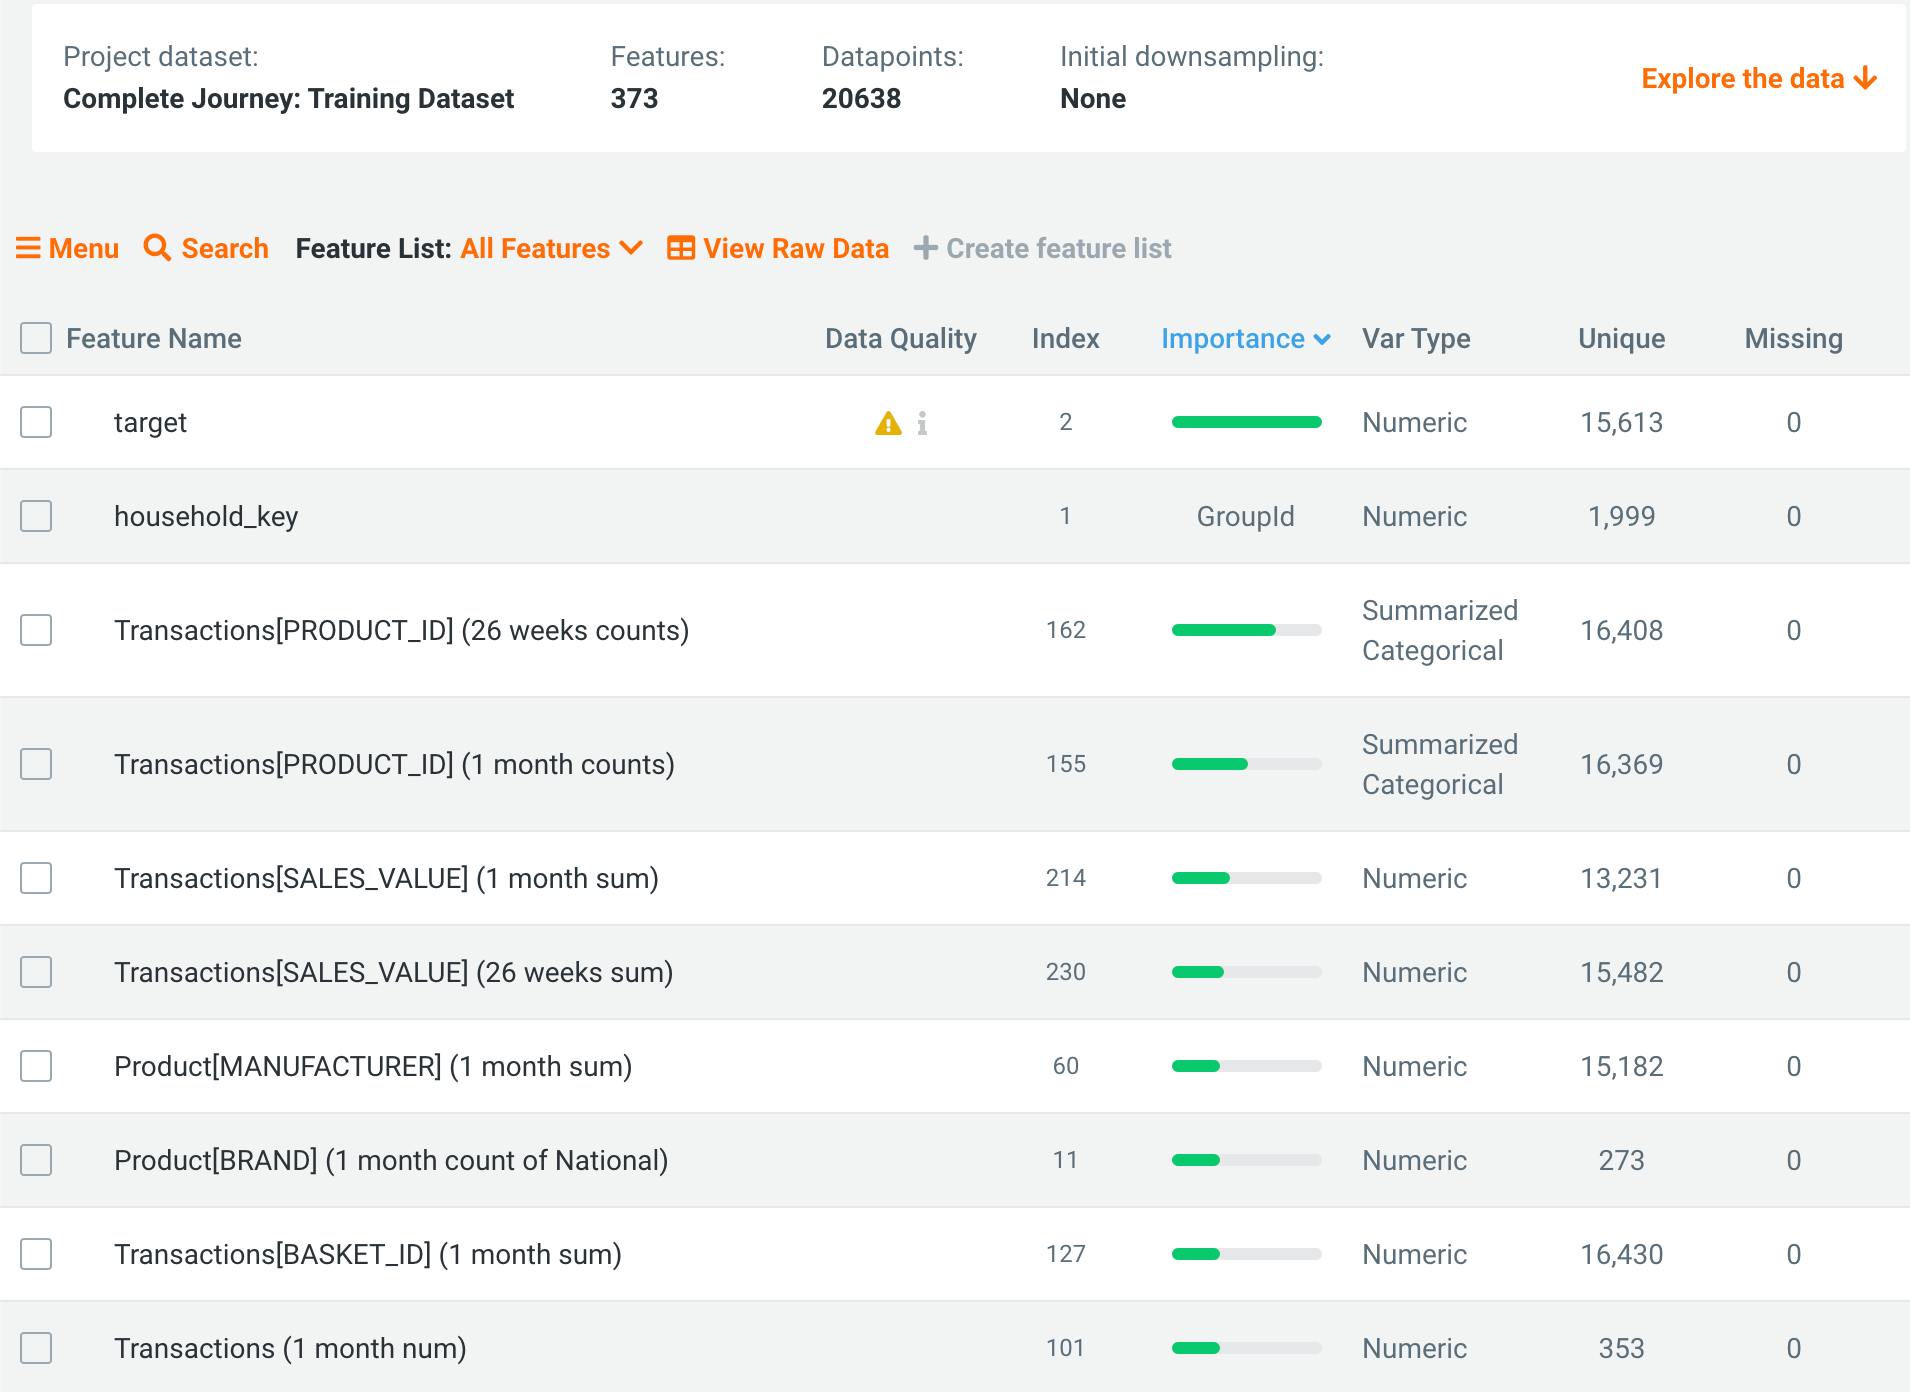
Once feature discovery has finished, the project now has over 300 features, including things like the sum and number of transactions over the last month and half-year, transaction counts by product categories, time differences between transactions, and many more!
Model Training
DataRobot AutoML automates many parts of the modeling pipeline. Instead of having to hand-code and manually test dozens of models to find the one that best fits your needs, DataRobot automatically runs dozens of models and finds the most accurate one for you, all in a matter of minutes. Take a look here to see how to use DataRobot from start to finish, and how to understand the data science methodologies embedded in its automation.
The final part of setting up our project is ensuring that we have the right partitioning mode. As there are multiple snapshots of each customer in the dataset, we should set the project to use group mode, so that a customer cannot appear in both a training and a validation partition. If that happens, we may have target leakage from future snapshots of a customer providing information to previous snapshots! (For more information on how to configure partitioning, see here. And for a detailed description of target leakage, see here.)
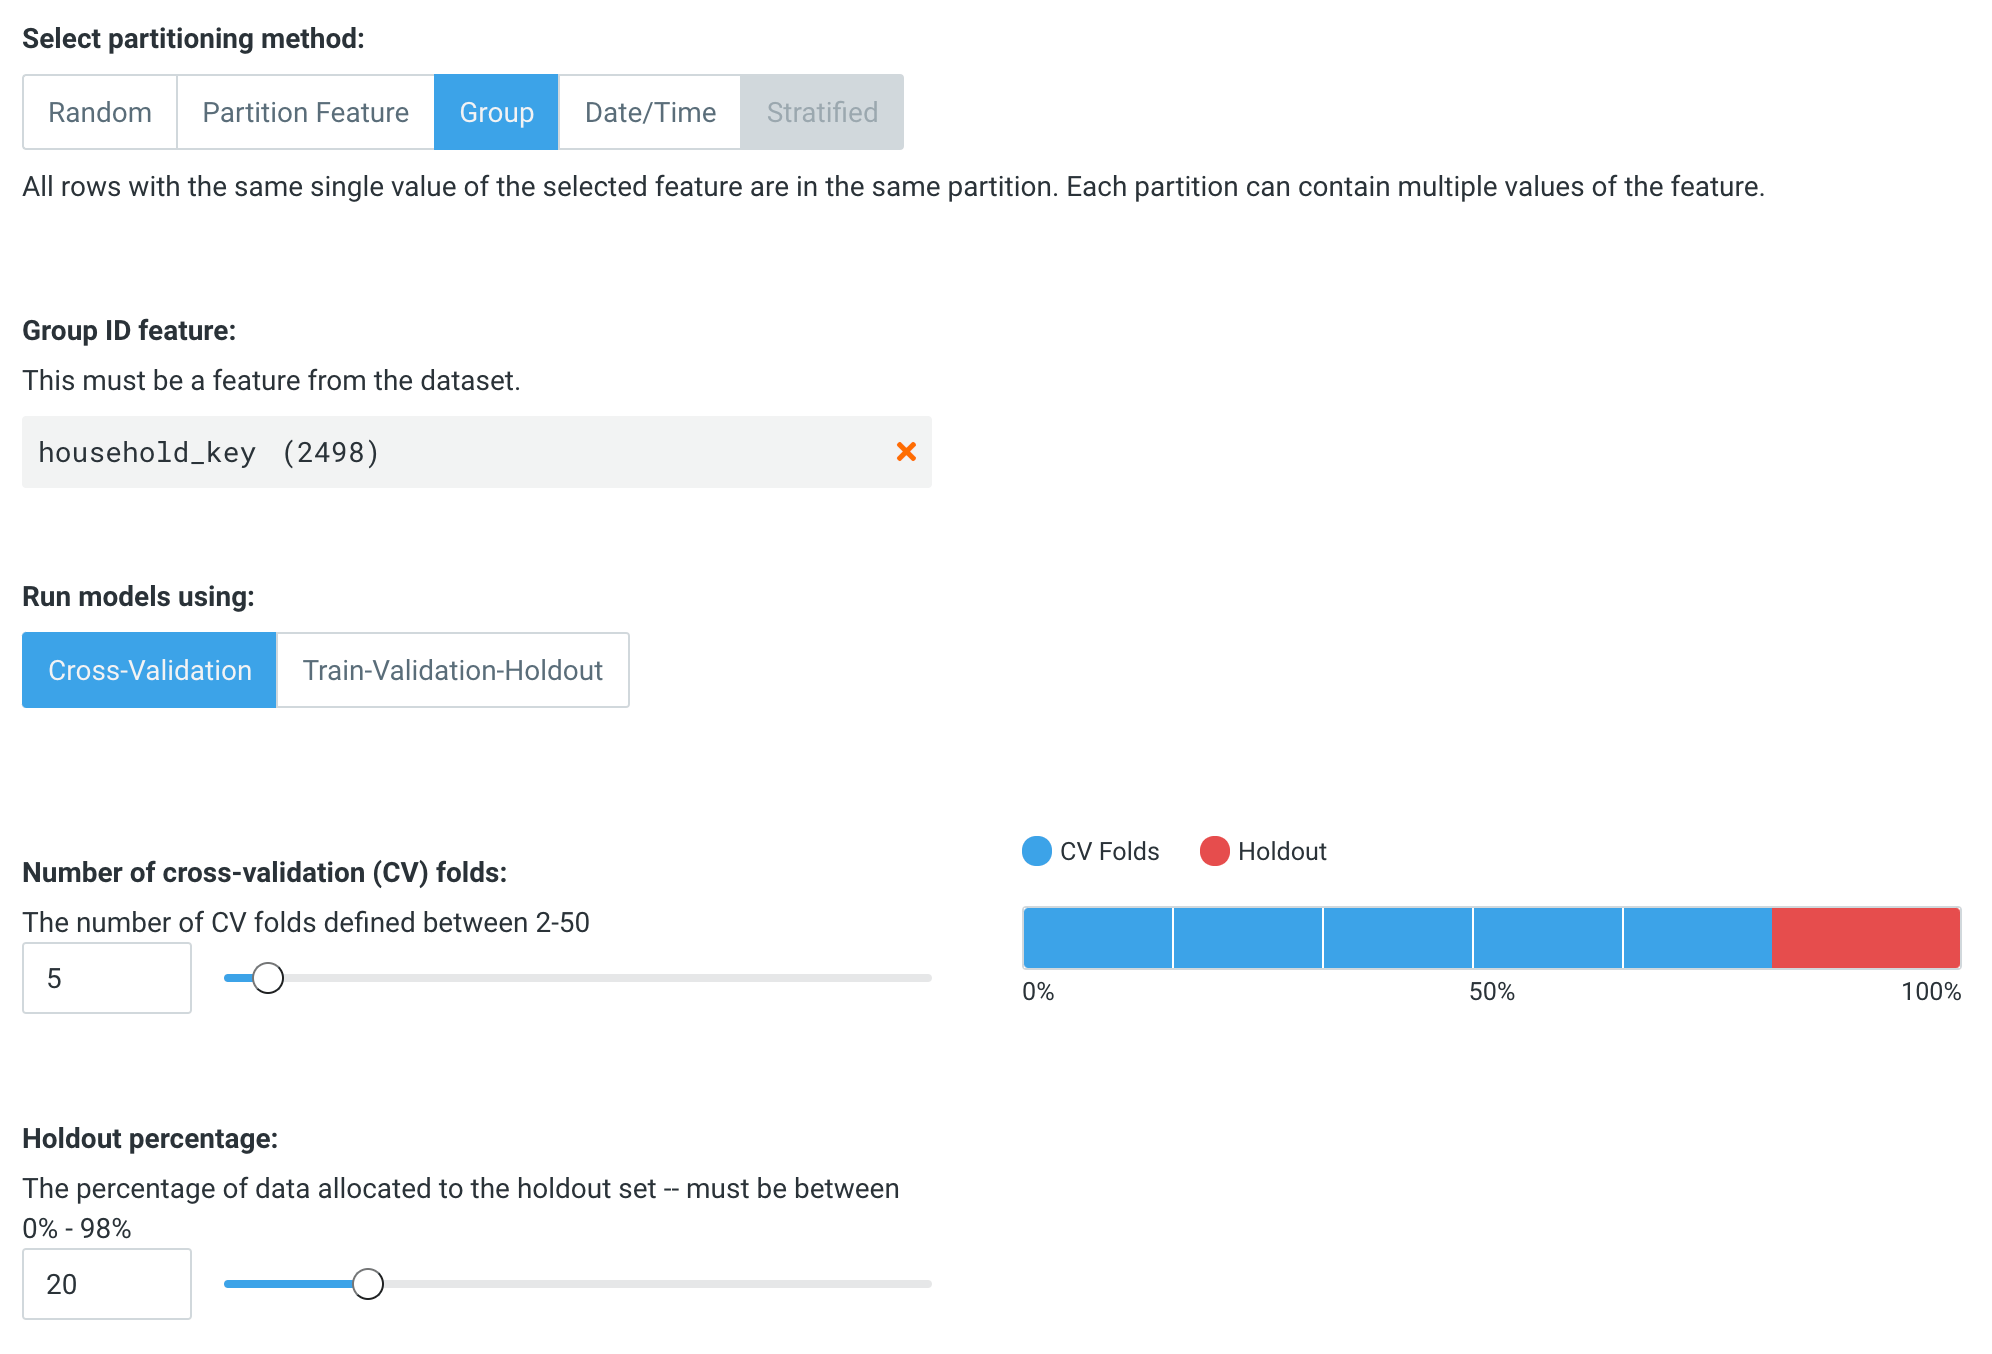
Once this is done, we’re ready to click Start to begin modeling. DataRobot will automatically churn through the the transaction records to build accurate models.
Interpret Results
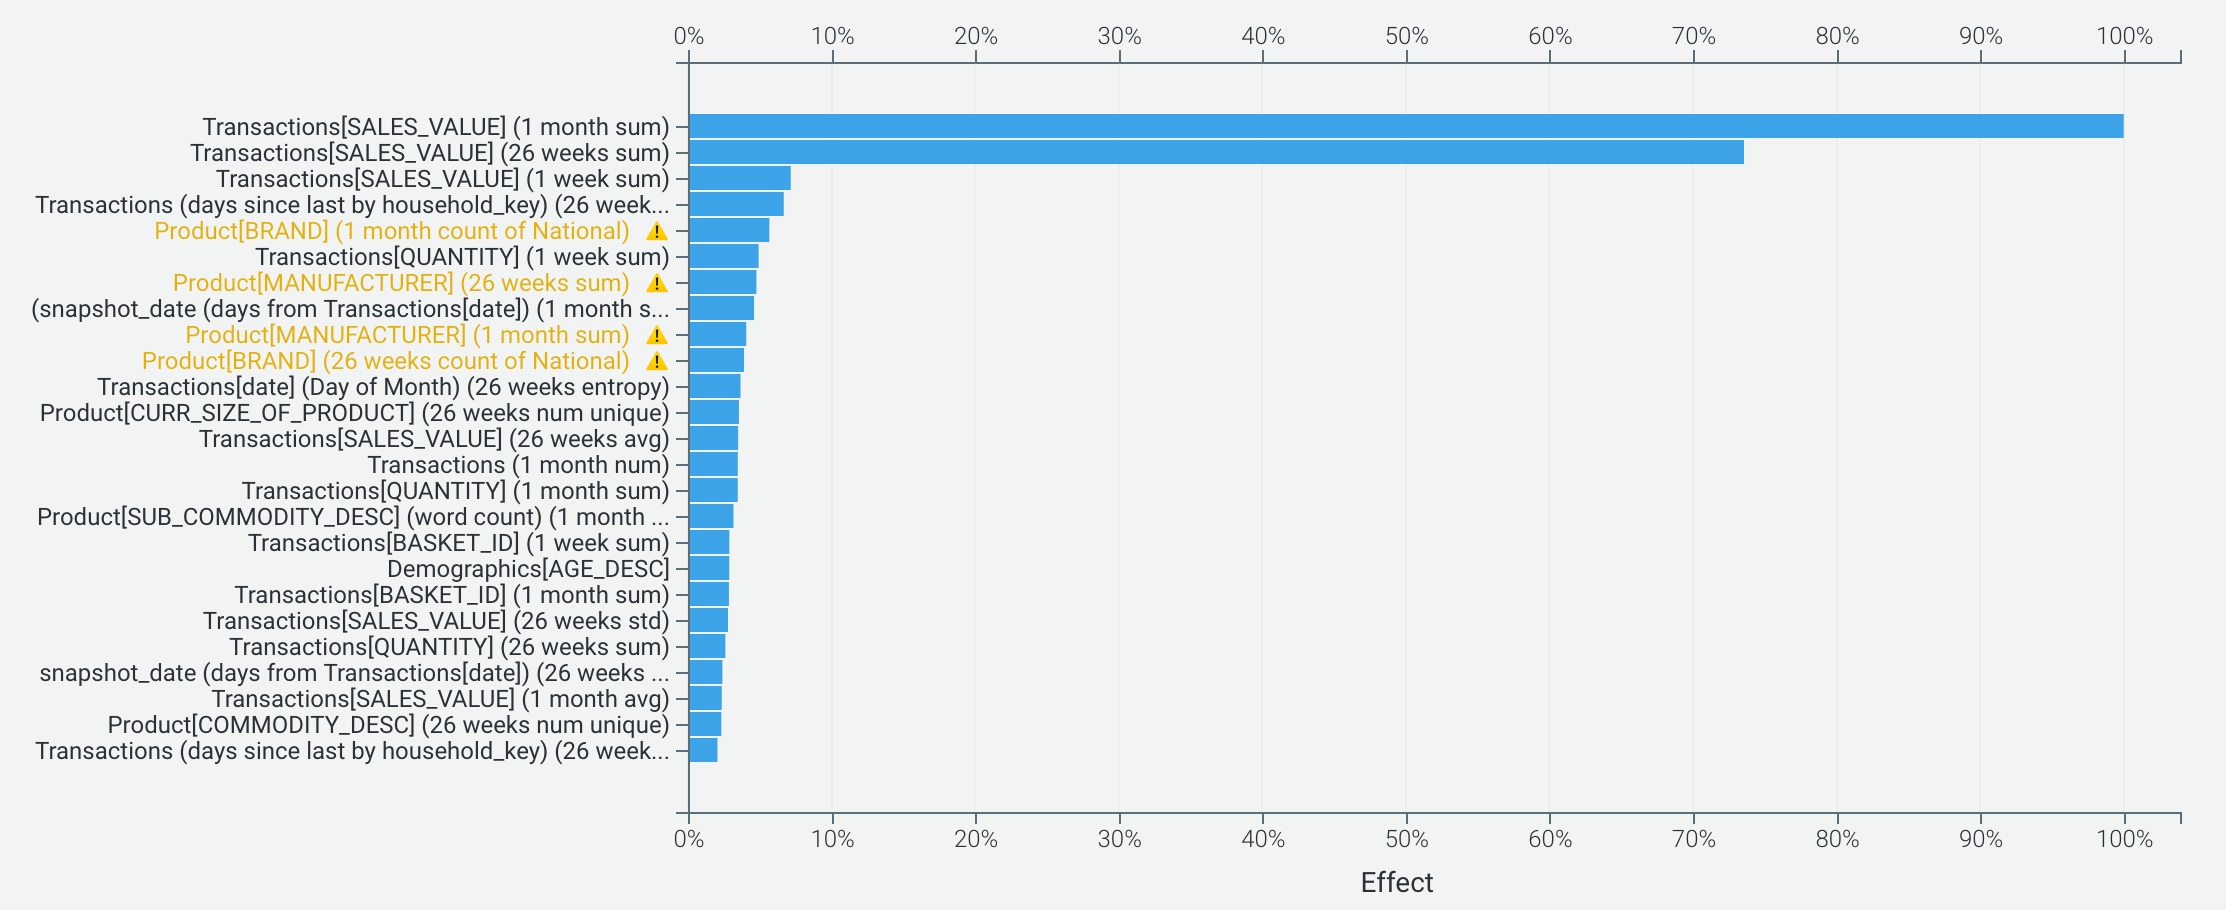
All of DataRobot’s models provide a number of insights to help explain why models are making the predictions they do. At the top level, the Feature Impact tab shows the overall importance of different inputs to the model. It comes as no surprise that previous transactional behavior is key to predicting future value, but we also see that the model is using information from product descriptions and homeownership status (perhaps as a proxy for loyalty).
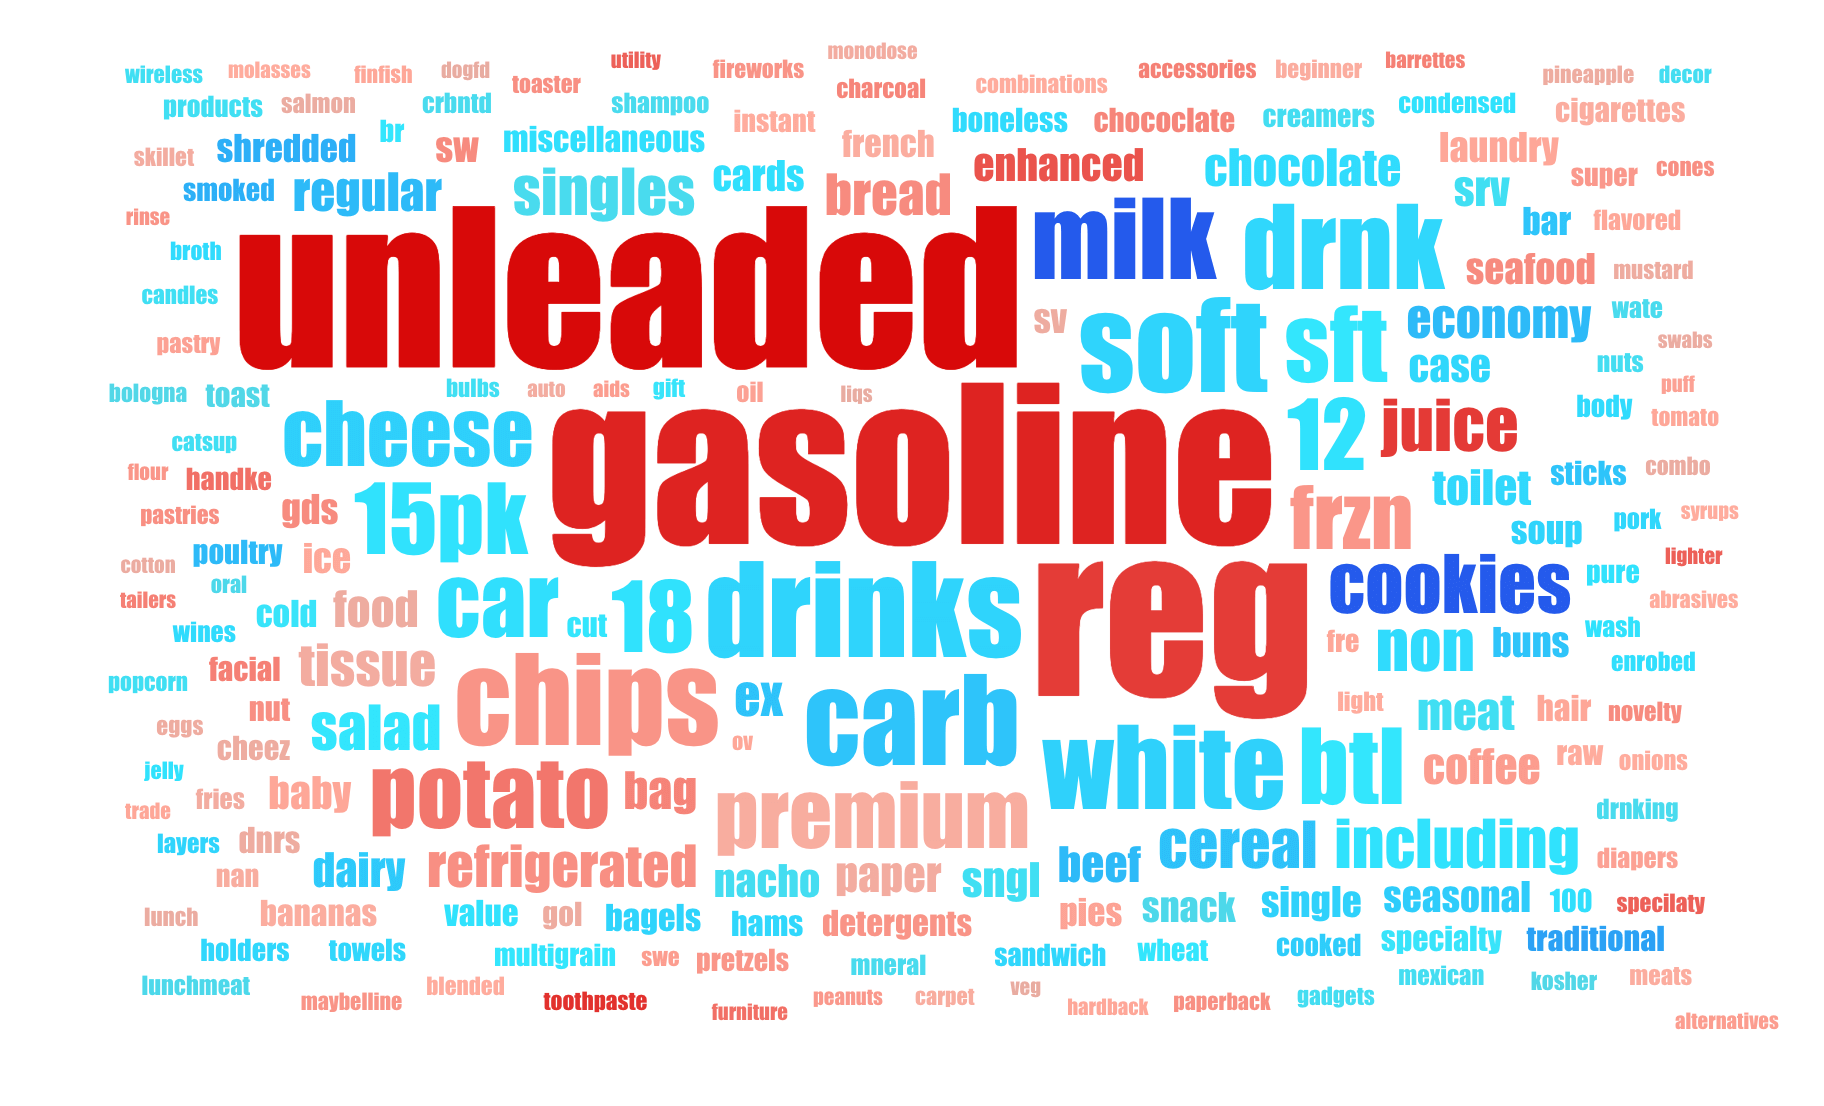
If we want to dig into how product description text may be contributing, it’s easy to understand what types of products are purchased by high- and low-value customers. In the Word Cloud insights, red indicates a correlation with higher value, and blue with lower value. In this dataset, it seems that customers who purchase “milk” and “cookies” are less likely to have high long term value, while “unleaded” and “gasoline” indicate more long term value.
Evaluate Accuracy
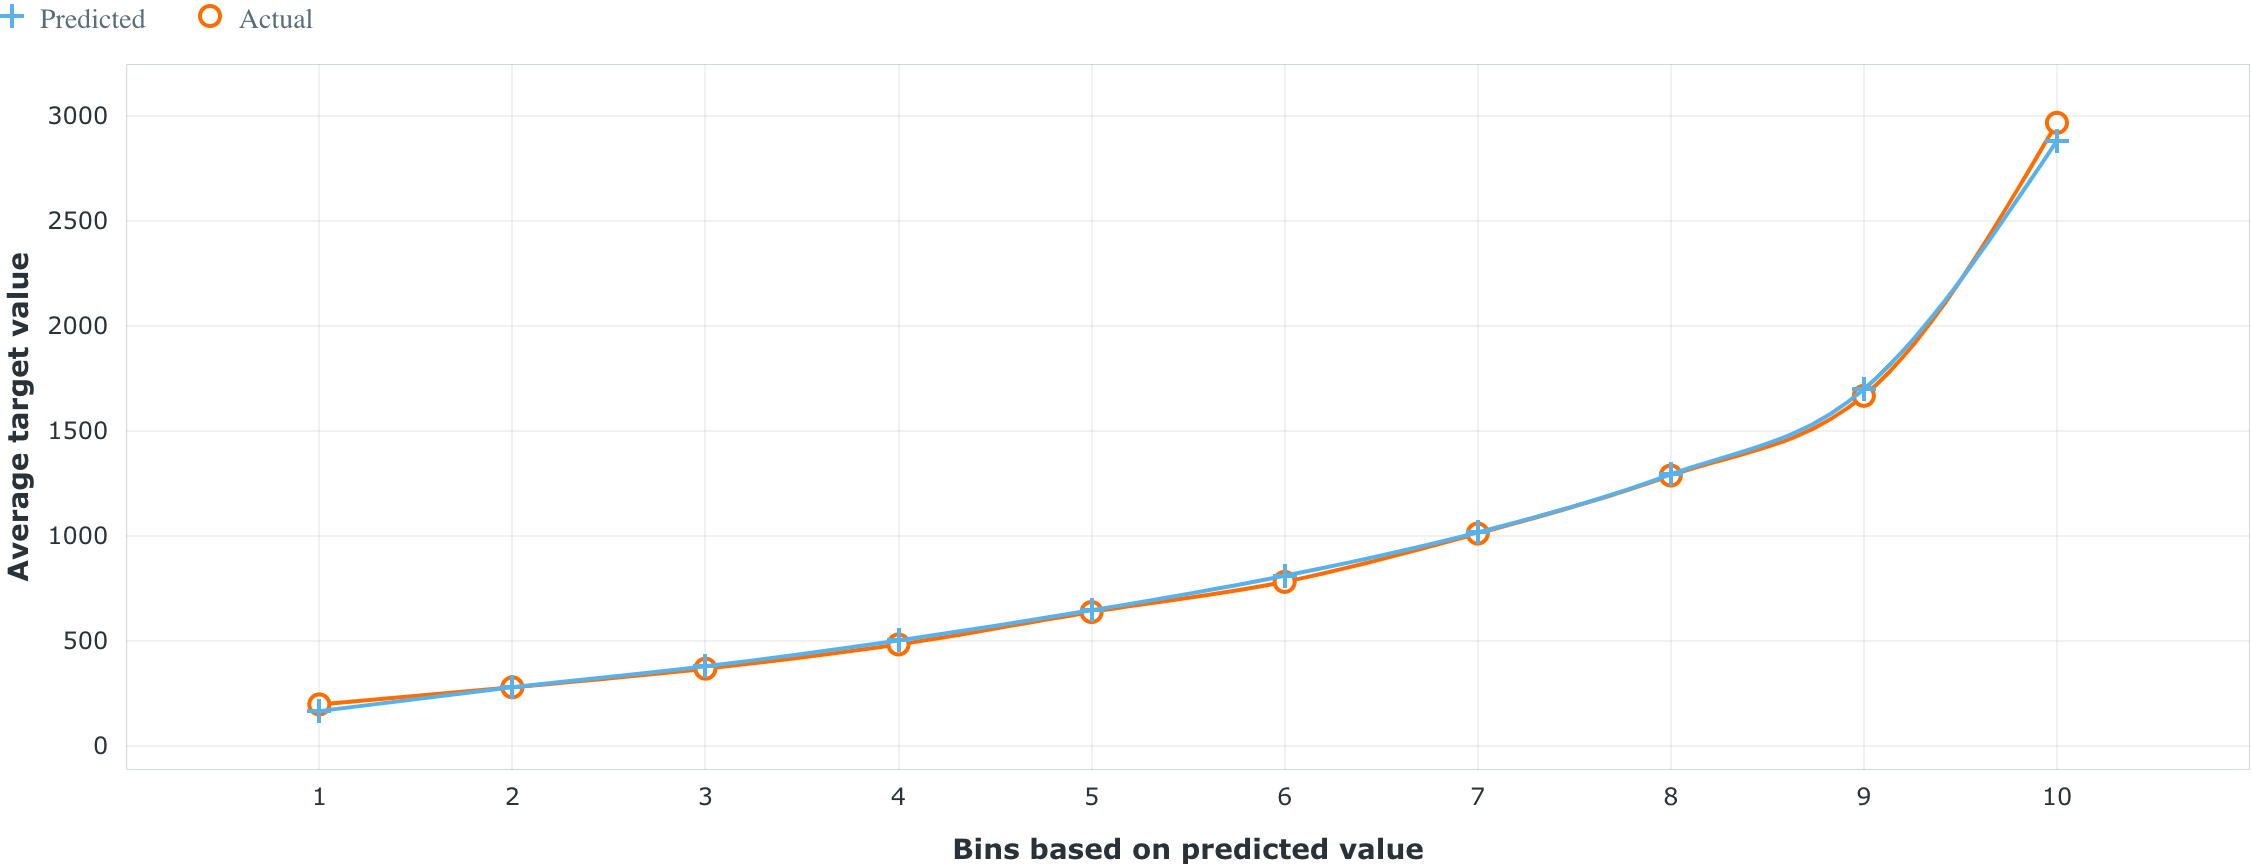
When it comes to evaluating the performance of a model, it’s key to ensure that a model manages to separate low- and high-value customers. The Lift Chart is a great way to visualize this—the chart itself sorts the predictions the model made from lowest to highest and then groups them into bins. The blue and orange lines depict the average predicted and average real probability (respectively) for a particular bin. A good lift chart would have the orange and blue lines “hugging,” as that would mean your model is making predictions close to the real values, and it should show a large gap in predicted value between the top and bottom bins.
Taking a look at the top model on the Leaderboard, we can see that the Lift Chart shows that the model is quite good at distinguishing high- and low-value customers.
Post-Processing
Given the large potential range of customer values, you may want to consider simplifying the model’s predictions so that decision executors have an easier time in interpretation. A basic way of doing this would be to group your customers into buckets. Common approaches include splitting customers into low, medium, high-value groups, or even deciles if you need more granularity.
Instead of a store manager making a decision based on a model predicting a customer is worth $1739, it’s easier to understand if the output states that the customer is in the top 10% of most valuable customers.
Business Implementation
Decision Environment
After you finalize a model, DataRobot makes it easy to deploy the model that will predict customer lifetime value into your desired decision environment. Decision environments are the methods by which predictions will ultimately be used for decision-making.
Decision Maturity
Automation | Augmentation | Blend
Depending on the specific part of a customer journey, a customer lifetime value prediction can be used to either automatically define actions, or to augment business decision making.
Model Deployment
Having the ability to quickly and easily look up a customer’s value is key to maximizing the value of these predictions. As a result, dashboards or integrations with customer relationship management systems (CRMs) will significantly decrease the friction between decision makers and provide all the necessary information.
For existing customers, the potential value is unlikely to drastically change in real-time; instead, batch scores on a daily or even weekly basis are generally sufficient to feed into these systems. However, when attempting to acquire new customers, or when working in an eCommerce environment, there may be an advantage to having a real-time API call to obtain model predictions. Some retailers may even opt for custom-built mobile applications, in order for decision makers to have timely information in a readily accessible format.
Decision Stakeholders
Decision Executors
- Store Manager
- Campaign Manager
Decision Managers
- Chief Marketing Officer
- Chief Operations Officer
- General Manager Loyalty
Decision Authors
- Business Intelligence Analyst
- Data Scientist
- Product Specialist
Decision Process
The predictions on the future value of customers can benefit sales in various ways. When it comes to defining individualized discount levels, it’s easiest to just let the model automatically determine the best prices for each customer. But for other types of engagements, such as creating new products for higher-value customers, these predictions will just be one input to an overall approach that requires business expertise and domain knowledge.
In addition to model predictions, users will benefit from having Prediction Explanations to describe why a customer seems to be higher or lower value. Insights indicating whether a predicted value is due to customer demographics, transactional behavior, or past interactions with the retailer can be very impactful when determining the right course of action to take for each customer.
For customers predicted to have high values, examples of actions that campaign managers could take include offering them with special promotions to join loyalty programs, sending special gifts to develop customer intimacy, or inviting them to attend exclusive launch events; all of these nurture the relationship with the customer and maximize the likelihood of longer-term retention.
Model Monitoring
- Decision Operators: IT/System Operations, Data Scientists.
- Prediction Cadence: Batch predictions generated on a daily or monthly basis.
- Feedback Loop: As actual interactions with customers are measured, update historical predictions with real values.
- Model Retraining Cadence: Models can be retrained once accuracy drops past an assigned threshold; otherwise, models can be retrained at least quarterly to account for changes in behavior.
Implementation Risks
- Failure to make predictions actionable.
- Failure to ensure that all decision-makers understand what the prediction value represents in terms of timeframes.
- Lack of consistency across different business lines. If different values are prioritized by different teams, e.g., tied to different KPIs, then customers may receive conflicting messaging and service.

Experience the DataRobot AI Platform
Less Friction, More AI. Get Started Today With a Free 30-Day Trial.
Sign Up for Free
Explore More Use Cases
-
RetailVendor Invoice Fraud
Predict the likelihood that a vendor invoice is fraudulent.
Learn More -
RetailForecast Demand for Staffing in Retail / DC / Warehouse
Forecast the volume of inbound shipments required over the next month to allocate the right levels of staffing.
Learn More -
RetailPredict Performance of Sellers
Maximize the productivity of your sellers by predicting the performance of each seller throughout the determined selling period.
Learn More -
RetailForecast Daily Demand by Store
Demand forecasting / sales forecasting with AI/ML helps reduce overstocks and out of stocks, helping you optimize your supply chain and working capital.
Learn More