

Maximize Conversion Rates on Seasonal Catalogs
Overview
Business Problem
Until now, marketers have relied on rules-based approaches to identify which customers should receive catalogs in the hopes that they will make a purchase. While direct mail such as catalogs have decreased in volume over recent years, they still prove to be effective marketing strategies when trying to stand out amid all of the emails and messages customers receive on a daily basis. The clear downside of catalogs is the high cost required to deliver physical booklets to a customer’s front door. Therefore, sending a catalog only makes sense when a marketer is confident the customer will respond positively to what they find in their mail.
The challenge with rules-based approaches is that they do a poor job of finding which customers will respond positively or negatively to the catalogs they receive. They frequently overgeneralize assumptions made to large segments of customers onto each individual person, where these assumptions may not necessarily apply. As a result, marketers are unable to maximize the ROI from their marketing campaigns.
Intelligent Solution
The key to unlocking catalogs is to only send them to customers who are most likely to respond. In doing so, marketers can ensure that the cost of acquisition is always justified by the subsequent rise in customer value.
AI helps retailers predict the likelihood someone will respond to a catalog based on their unique characteristics and purchasing behaviors. Retailers can then triage their customers by their probability of response, and only send catalogs to customers who are most likely to respond.
Compared to rules-based approaches, AI is better at finding which customers will respond by learning from vast amounts of data and capturing complex patterns in customer behavior. In addition to showing which customers will respond, AI also informs marketers of the underlying reasons why. AI provides marketers with the top statistical drivers behind each response, allowing them to personalize their marketing campaigns to meet the unique needs of each customer.
Value Estimation
How would I measure ROI for my use case?
Here is a top-down approach on how to perform an ROI calculation for this use case. After effectively building your response model, you can evaluate its business impact through an experiment where you apply the models’ predictions to a majority of the catalogs sent, but still leverage your pre-existing segmentation approach for a subset of the catalogs. These can be labelled the new method and old method, and applying both approaches at once will allow you to compare them apple-to-apple. For this example, we make the assumption that implementing a response prediction model will increase the average response from 10% to 15%.Assumptions (example):
- Number of catalogs = 1M (for each season)
- Cost per catalog = $3
- Average purchase amount per response: $100
- Marginal gross profit rate: 40% (excluding catalog costs)
- Average response rate = 10%
- New method average response rate = 15%
- We suppose a design with 90% of new method vs 10% of old method
New method vs old method ROI:
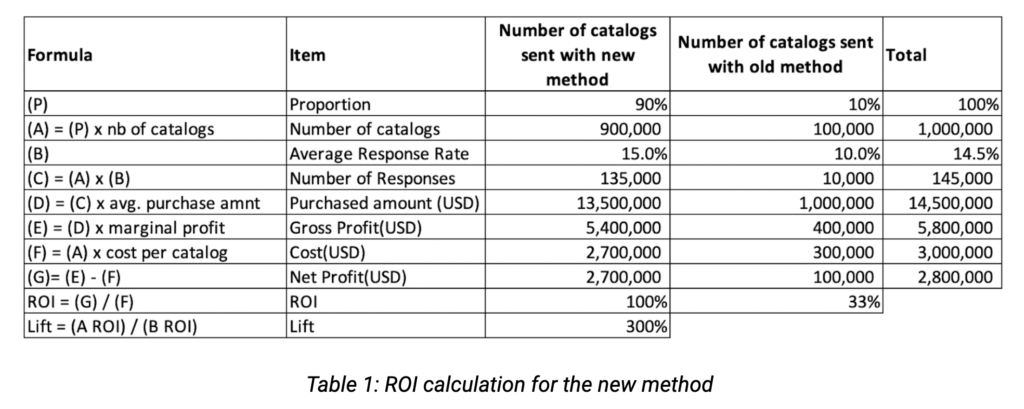
If we were to only consider the old method for 100% of the catalogs, then the resulting net profit would only be $1,00,000 ($100,000 * 10). However, by implementing the new method for 90% of catalogs, net profits would rise to $2,700,000 due to the 5% increase in conversion rates, leading to a rise in ROI of $1,700,000 ($2,700,000 – $1,000,000).
The proportion between customers selected by the model and selected at random needs to be balanced between:
- Number required to reach statistical significance.
- Number needed to have a stable model.
This is a simplified experimental design. Depending on your business problem, you may consider a more complete and comprehensive design to capture the impact of your catalogs / direct mail campaigns.
Technical Implementation
Before We Get Started
Response modeling is one of the most common use cases in the marketing area. However, there are several pitfalls to be cognizant about when building these predictive models. The most common ones are as follows:
- Pitfall 1: “We only targeted valuable customers by selecting customers with the highest response probability, and neglected to consider new customers”
- Pitfall 2: “Why is the customer base so small? Oops… We forgot to include customers that did not purchase via catalog”
- Pitfall 3: “After refreshing the model a couple of times, actual results are not as good as before. It seems we send too many catalogs to the same customers.”
In order to avoid these pitfalls, it is very important to step back and ask yourself a few key questions around the design of your catalog / direct mail campaign:
- What are the customer segments that you would like to reach?
- What is the objective of sending catalogs / direct mails to your customers?
- What is the definition of success and should you measure it?
Considering these questions in advance will ensure that you correctly set up the problem and can focus on building accurate models while taking into account their business impact.
We have listed below an example of the key steps needed to build an accurate response model for both the near and long term:
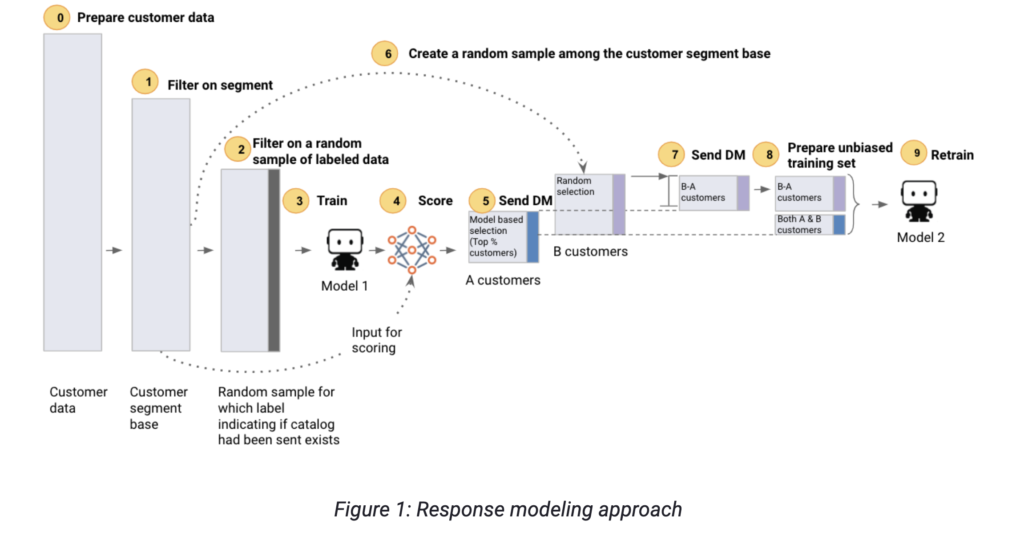
- Step 1. Filter on segment so that you are targeting the right customer segment for your direct mail campaign. For instance, you may address only your active customers (e.g., at least one transaction in the past 5 years), your most valuable customers (e.g., 10 transactions or more in the past 5 years), or your new customers (e.g., one transaction in the most recent year). This enables you to avoid pitfalls 1 and 2.
- Step 2. Filter on a random sample of labeled data so that you can define your target variable as whether or not a customer made a purchase by catalog, among the customers who have received a catalog.
- Step 3. Train: Train your predictive model.
- Step 4. Score: Score your customer segment base.
- Step 5. Send DM (direct mail): Assuming you have to send a fixed number of catalogs, then send catalogs to the top x% of your customers until you’ve depleted your stock of catalogs.
- Step 6. Create a random sample among the customer segment base: Ensure that you can have access to unbiased training data when you will re-train the model. Enables you to avoid pitfall 3.
- Step 7. Send DM: Effectively send catalogs to the randomly selected customer sample. Enables you to avoid pitfall 3.
- Step 8. Prepare the unbiased training set: When refreshing the model (for the same season in the following year, for example) ensure that you are using unbiased training data. Enables you to avoid pitfall 3.
- Step 9. Retrain: Retrain the model; you restart at step 4.
About the Data
For this tutorial, we use a simplified synthetic dataset for a fashion retailer whose clothing assortment is renewed on a seasonal basis for spring, summer, autumn, and winter seasons. The hypothetical retailer has brick and mortar stores spread across the U.S. and sends catalogs by direct mail to its customer base in the beginning of each season.
As this is a simplified dataset, we will provide as well a list of other features that are worth exploring (but not fully exhaustive). Final datasets can potentially reach 500+ features depending on data availability and data engineering resource availability.
Problem Framing
The target variable for this use case is whether or not a customer who received a catalog made a response in the form of a transaction. This choice in target makes this a binary classification problem. For this guide, let’s assume that we want to score customers depending on their likelihood of purchase for the winter season.
While the context of this use case is around catalogs and direct mail, the machine learning techniques described in this guide can be applied to any form of lead scoring, including online campaigns.
The features below represent key factors that are important in predicting the purchase via catalog. They encompass each customer’s demographics, previous behavior (RFM variables), previous direct marketing activities (recency and frequency of catalogs previously sent, catalog stock variables), which will help DataRobot find relevant patterns across the customer base to assess every customer’s likelihood of response.
Beyond the features listed below, we suggest incorporating any additional data your organization may collect (other marketing activities, pricing, discount, promotions, etc.). As you will see later, DataRobot is able to quickly differentiate important/unimportant features.
These features are generally stored across internal data sources available in your organization, such as customer information, customer transactions, past catalog / direct mail activities, product information, and customer service information.
Other external data sources that may also be relevant may include zip code level demographics data.
Sample Feature List
For our dataset, we created features by seasons; you could create similar features by brand or product category if this is important for your business. (We wanted to keep this list of features small and so have not included them.) Note that recency is calculated as time elapsed in the quarter, with a value of 99 indicating no purchase in the last year.
The data looks like the following, where each example is an individual customer.
| Feature Name | Example 1 | Example 2 | Example 3 | Example 4 | Example 5 |
|---|---|---|---|---|---|
| customer_id | 100001 | 100002 | 100003 | 100004 | 100008 |
| age | 60 | 35 | 60 | 65 | 70 |
| gender | female | female | female | female | male |
| state | Maine | Oklahoma | Alabama | Hawaii | Illinois |
| prev_year_txn_nb_winter | 0 | 0 | 0 | 12 | 0 |
| prev_year_txn_nb_spring | 0 | 0 | 0 | 0 | 1 |
| prev_year_txn_nb_summer | 0 | 0 | 1 | 0 | 1 |
| prev_year_txn_nb_autumn | 0 | 0 | 0 | 2 | 8 |
| prev_year_basket_size | 0 | 0 | 25 | 53 | 24 |
| prev_year_txn | 0 | 0 | 1 | 14 | 10 |
| prev_year_amnt | 0 | 0 | 25 | 747 | 243 |
| recency | 99 | 99 | 2 | 1 | 1 |
| prev_year_catalog_txn_winter | 0 | 0 | 0 | 0 | 0 |
| prev_year_catalog_txn_spring | 0 | 0 | 0 | 0 | 0 |
| prev_year_catalog_txn_summer | 0 | 0 | 0 | 0 | 1 |
| prev_year_catalog_txn_autumn | 0 | 0 | 0 | 1 | 0 |
| target | 0 | 0 | 0 | 1 | 0 |
| partition | 1 | 1 | 1 | 1 | 1 |
Data Preparation
We assume data follows a star schema:
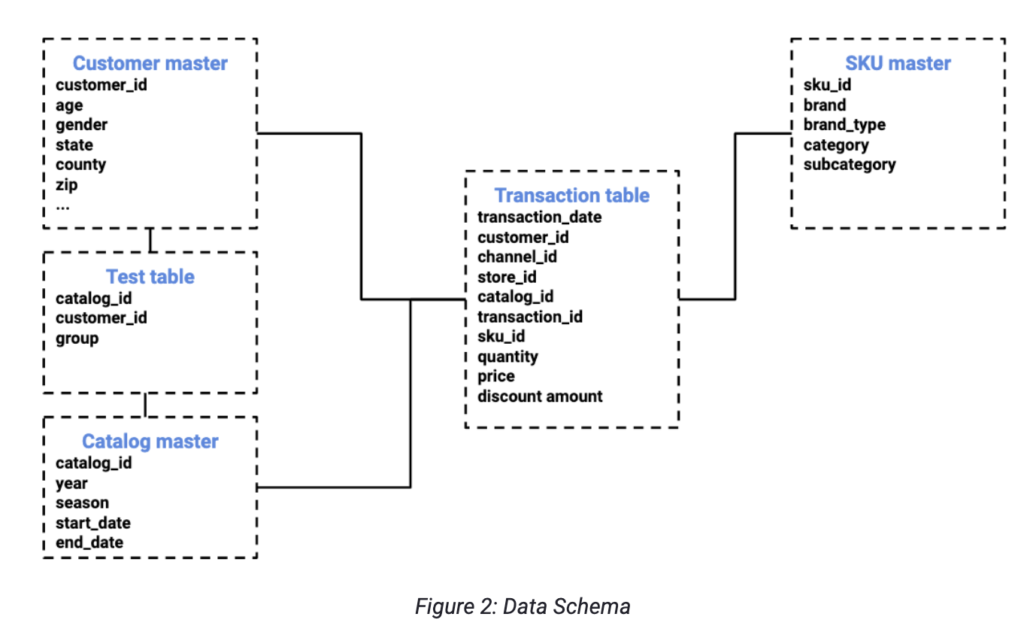
This data model design especially enables you to:
- Identify customers who received catalogs in the past and whether they were selected by the model or randomly (in the Test table with the group variable).
- Identify whether customers have purchased through a catalog (in Transaction table, catalog_id variable).
In order to build your training dataset, key data engineering steps are as follows:
- Create your training dataset MVP by:
- Selecting customers that were sent winter catalogs in the past.
- Creating the target variable by looking in the Transaction table to determine whether a customer made purchases via winter catalogs.
- Create all the other features at catalog_id x customer_id granularity. Each of these features is based on data from seasons prior to the winter catalog season used as a target. It is very important to respect this to avoid any target leakage (i.e., using data from events that occurred after the catalogs were sent).
- Merge other features with training dataset MVP.
Model Training
Now that you are done with data engineering, you can start modeling! DataRobot AutoML automates many parts of the modeling pipeline. Instead of having to hand-code and manually test dozens of models to find the one that best fits your needs, DataRobot automatically runs dozens of models and finds the most accurate one for you, all in a matter of minutes. In addition to training the models, DataRobot automates other steps in the modeling process such as missing values imputation or one-hot encoding of categorical variables.
Take a look here to see how to use DataRobot from start to finish and how to understand the data science methodologies embedded in its automation.
Interpret Results
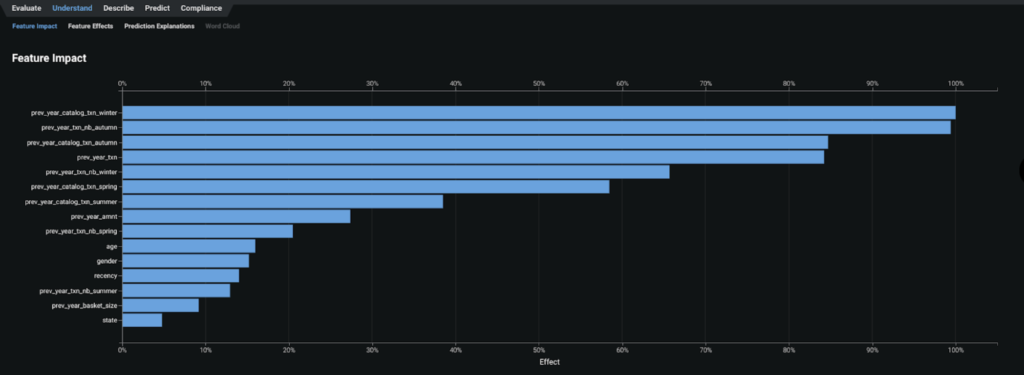
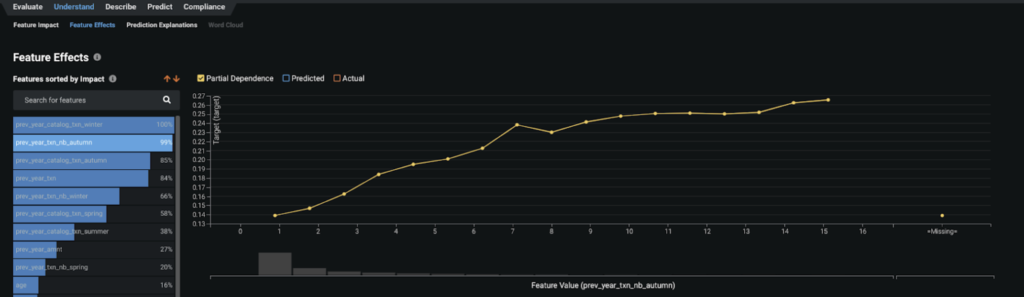
- By taking a look at the feature importance chart, we learn the two most impactful features that contribute to whether a customer will buy via catalog for this winter:
- having bought via catalog at the same period the previous year (winter)
- having bought in the autumn
We see here as well that the model can capture more granular patterns compared to a simple RFM approach that would have disregarded the timing of past purchases. It is important to confirm with the business side whether such behavior makes sense and that you can trust the way your model has learned.
- We take a look at the partial dependence plots to further evaluate the marginal impact top features have on the predicted outcome. We learn that the more a customer bought in the recent autumn season, the more likely they are to purchase via catalog for this winter (from 15% probability for one transaction to over 20% for five transactions or more). The partial dependence plot is available for other features as well.
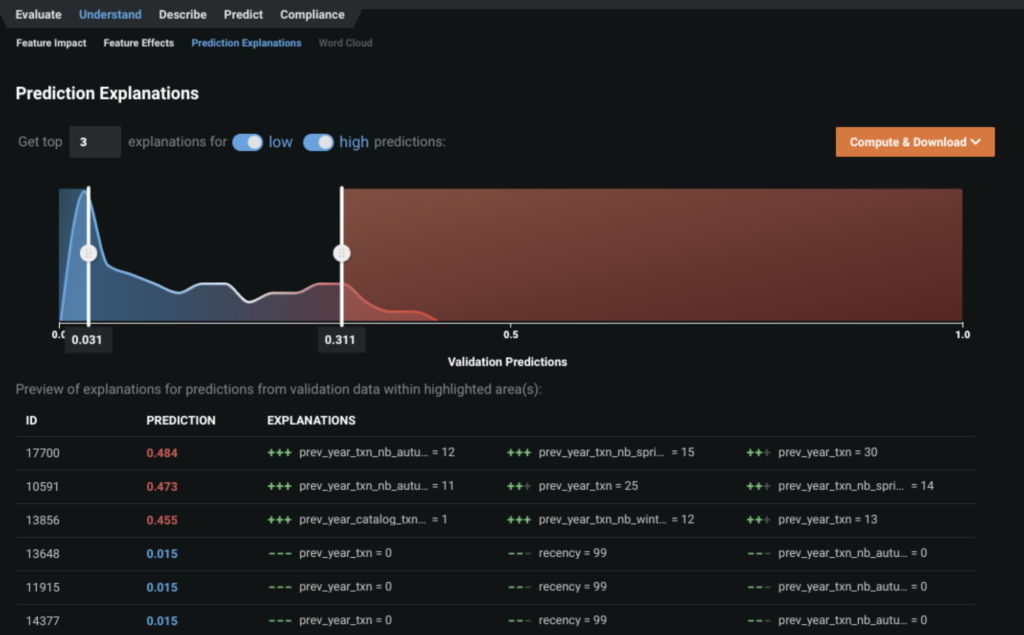
- DataRobot’s Prediction Explanations provide a granular view – on the individual customer level – to interpret the model results. Here, we see why a given customer was predicted to purchase or not via winter catalog based on the top predictive features. These explanations are especially important when you provide the final customer list to a business stakeholder. It is important to confirm with them that it makes sense to send these customers the winter catalog.
Evaluate Accuracy
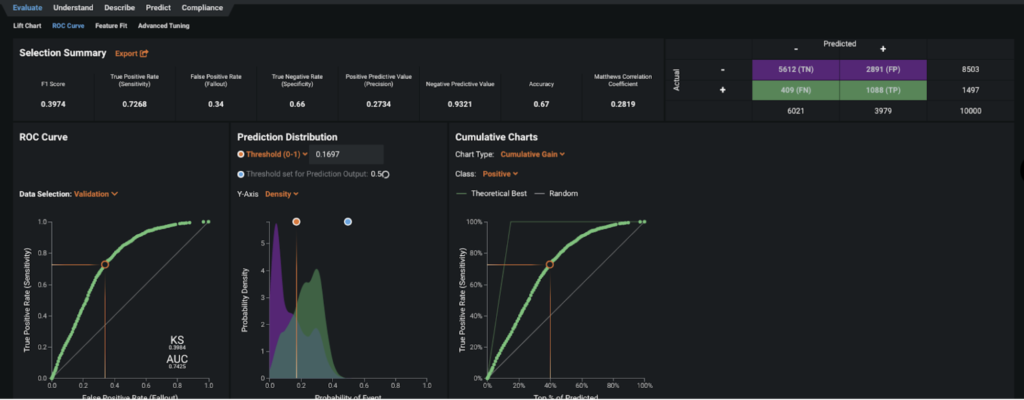
The ROC Curve tab in Figure 5 allows you to check how well the prediction distribution captures the model separation. You can use the provided confusion matrix to explore the appropriate threshold for separating the positive group from the negative group. For our purpose, the positive group contains customers likely to make a purchase via the winter catalog, while the negative group would not purchase.
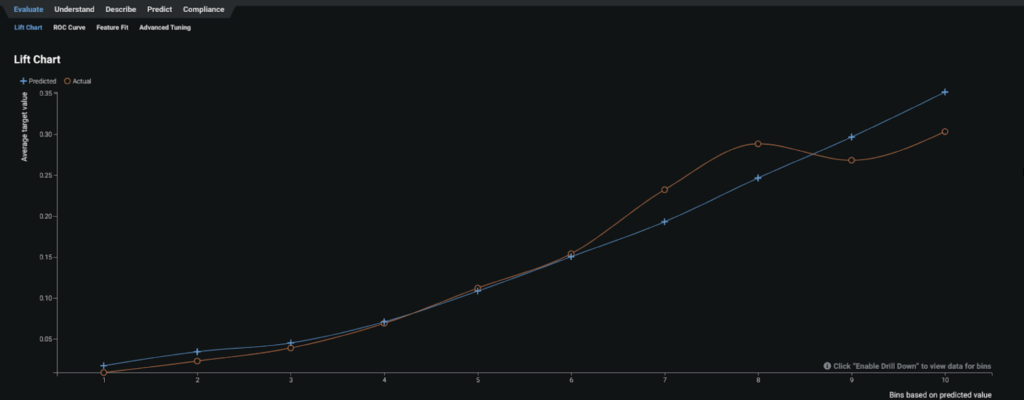
The Lift Chart in Figure 6 shows how well a model segments the target population and how capable it is of predicting the target, letting you visualize the model’s effectiveness.
Post-Processing
After creating and validating the response model, the very last step is to create and score the customer list to which the winter catalog should be sent. We are constrained in terms of the number of catalogs we can send (budget constraint). Therefore we would decide to send catalogs to the top x% of customers in terms of response probability until the stock of catalog is zero while ensuring that model performance is acceptable by looking at the confusion matrix.
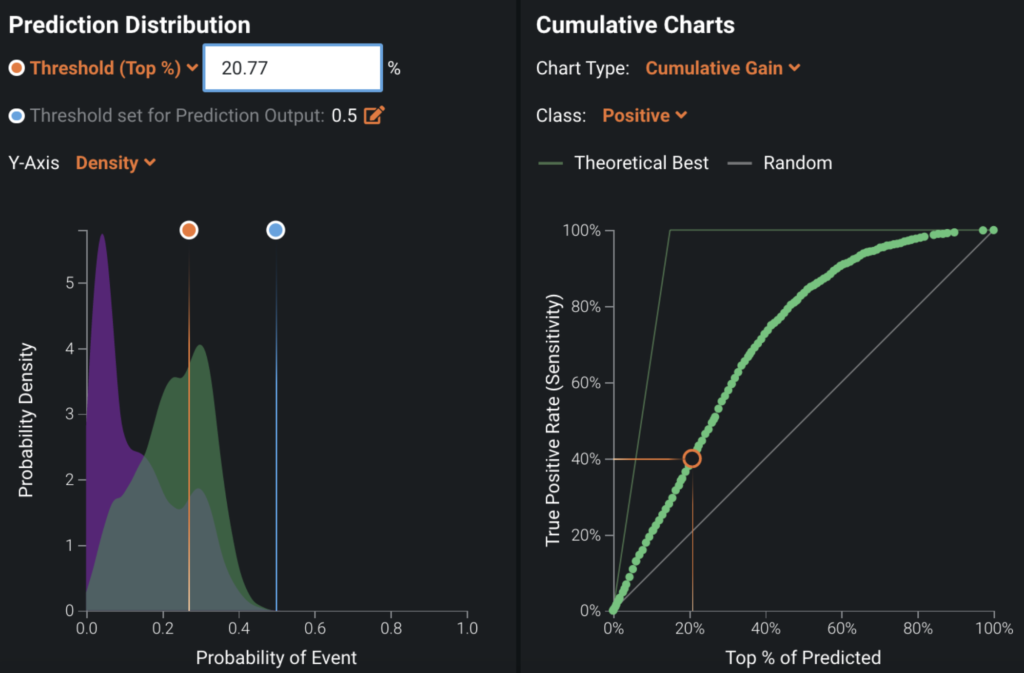
You can set up the positive class probability threshold that would allow you to select the top x% of your customer base while scoring (Figure 10). The cumulative charts show what percentage of customers likely to purchase via catalog can be reached in a given percentage of the data. For example in Figure 10, cumulative charts indicate that 40% of customers likely to buy are covered in the top 20% of data. By setting Threshold (Top %) to 20%, then DataRobot will automatically set up the corresponding probability threshold and when sending your catalog to the top ranked 20% of all customers you will reach the 40% of your customers who are likely to buy.
Business Implementation
Decision Environment
After you are able to find the right model that best learns patterns in your data to predict responses, DataRobot makes it easy to deploy the model into your desired decision environment. Decision environments are the ways in which the predictions generated by the model will be consumed by the appropriate stakeholders in your organization and how they will ultimately make decisions using the predictions that impact your process.
Decision Maturity
Automation | Augmentation | Blend
By using a response model, the selection of customers that should receive a catalog can become automated. However, discoveries from model insights also enable a deeper understanding of customer behavior for your business stakeholders. This will help your catalog managers have insights on which customer persona and customer needs to plan for in the future.
Model Deployment
There are a number of ways to deploy the predictions, here are a few:
- Connect to a database so that you can store information for the customers receiving catalogs, whether they were selected by the model or randomly. You can use this data for analysis purposes and as input to your future models.
- Connection to other systems you can connect to your CRM system in which you can automate the process for sending catalogs to the customers selected by the response model.
Decision Stakeholders
Decision Executors
Decision executors are the stakeholders who will use the customer target list coming out from the response model. They will use it to send catalogs.
- Catalog managers
Decision Managers
Decision managers are the executive stakeholders who will monitor and manage the customer selection program for the catalog.
- Chief Marketing Officer
Decision Authors
Decision authors are the technical stakeholders who will set up the decision flow.
- Data Scientist
- Marketing Analyst
- Business Analyst
Decision Process
The predictions from the response model will help your catalog managers identify which customers they should send catalogs to based on their likelihood of response. As mentioned before, catalog managers can set up prediction thresholds depending on their budget constraints. In essence, catalogs should be sent to the customers who are most likely to respond. For the remaining customers, more cost effective but less intimate channels can be leveraged; these may include emails or social media messages.
Model Monitoring
Monitoring of models should be done from both a modeling and business impact perspective:
- Model monitoring: Monitor performance metrics when retraining the model, monitor data drift when scoring the customer database (to detect potential change in customer behavior). DataRobot MLOps product can help monitoring such metrics.
- Business impact monitoring: As mentioned in the “The approach” section (under “Technical Implementation”), you need to measure the value generated by your response model against a control group. If you don’t do so, you would have no idea of how much value you are generating or if there is any issue in your approach.
Implementation Risks
Model risk
- Failure to appropriately design experiments to measure real business impact
- Failure to effectively select an unbiased sample for model training
- Failure to appropriately store the data needed for model training and retraining
Process risk
- Failure to include and convince all necessary stakeholders
- Failure to build requirements and execute model integration
People risk
- Failure to educate/train data science team and decision consumers/makers
- Catalog managers can potentially reject the customer list if they are unable to understand how the model makes its decisions. In addition to showing them the model’s logic through the interpretability plots, you should provide them with evidence (from a business perspective) that the model performs better than pre-existing approaches. It can be very helpful to compare the model results with any existing rule-based segmentation.

Experience the DataRobot AI Platform
Less Friction, More AI. Get Started Today With a Free 30-Day Trial.
Sign Up for Free
Explore More Use Cases
-
RetailPredict Customer Lifetime Value (CLV)
Understand the long-term value of your customers to make better-informed, short-term decisions on which customers to prioritize.
Learn More -
RetailVendor Invoice Fraud
Predict the likelihood that a vendor invoice is fraudulent.
Learn More -
RetailForecast Demand for Staffing in Retail / DC / Warehouse
Forecast the volume of inbound shipments required over the next month to allocate the right levels of staffing.
Learn More -
RetailPredict Performance of Sellers
Maximize the productivity of your sellers by predicting the performance of each seller throughout the determined selling period.
Learn More