

Likelihood of an Article Producing a Subscription
Overview
Business Problem
Today, over 76% of US digital news publishers have a payment method in place and experiment with subscription pricing, paywall models, and the best types of content for paid subscription success. Beginning in the last decade, websites began implementing paywalls as a way to increase revenue, often through the use of ad blockers. The effects of paywalls “vary significantly from company to company, ranging from a 24 percent increase in total sales to a 12 percent decrease,” because these media companies have staff leveraging their knowledge and expertise to decide which articles are worth locking behind a paywall (e.g., Forbes). They choose whether an article is put on the inside, for subscription only, or kept outside to lure the customer into a subscription as a loss leader.
Intelligent Solution
AI helps digital publishers gain in-depth knowledge of how readers are interacting with their content. By predicting which articles are most likely to get customers to subscribe, AI will help you create a more targeted paywall and increase subscription revenue. Articles that are more likely to lead to a subscription can be the ones you intentionally paywall. You can also give writers feedback on which stories and articles resonated with audiences and why. Adjusting the focus and content of your company allows you to better allocate resources to producing precisely the content that improves the likelihood of subscribing.
Technical Implementation
About the Data
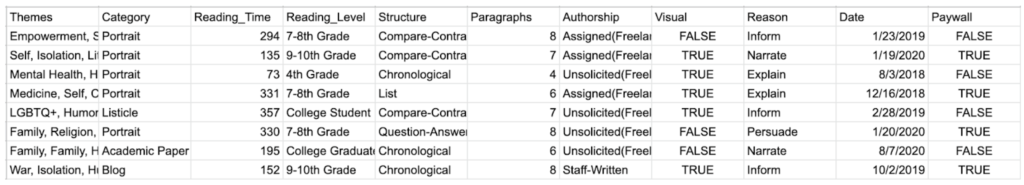
For this tutorial, we are going to use a synthesized dataset of 1000 articles, as it is for illustrative purposes only. Each record in the data represents a unique article. The dataset resembles realistic metadata for articles, but of course this can be vastly different depending on your company’s content and audience. Since this is a simplified dataset, we will provide features that are worth exploring without providing a fully-exhaustive dataset. For your AI, your final dataset could potentially reach 100+ features depending on data availability and data engineering resource availability.
Problem Framing
The target variable for this use case is whether or not the article is “worthy” of paywalling (Binary; True or False, 1 or 0, etc.). This choice in target makes this a binary classification problem.
The features below represent key characters that are important to predicting the likelihood of an article leading to subscription. They encompass metadata of each article, which will help DataRobot find relevant patterns across the article’s profile to assess their paywall “worthiness.” Beyond the features listed below, we suggest incorporating any additional data your organization may collect that could be relevant. As you will see later, DataRobot can quickly differentiate important vs. unimportant features. However, be careful of adding features that could result in target leakage.
These Article Data features are generally stored across proprietary data sources in your own company.
Other external data sources that may also be relevant include WordCounter or Readability and Google or Adobe Analytics.
Sample Feature List
| Feature Name | Data Type | Description | Data Source | Example |
|---|---|---|---|---|
| Paywall | Binary (Target) | If an article is “worthy” of paywalling | Article Data | True |
| Themes | Text | One or more one-word labels describing the themes of the piece | Article Data | Family, Isolation |
| Headline (Not included in mock data) | Text | What is the headline of the piece | Article Data | “How Quarantine is Impacting Families” |
| Category | Categorical | What category does the piece fall under | Article Data | Blog |
| Reading_Time | Numeric | The number of seconds it takes to read, based on the average reading speed of 275 words per minute | WordCounter | 108 |
| Reading_Level | Categorical | A measure of how easy a piece is to read | WordCounter | Seventh-Grade Level |
| Structure | Categorical | The format of the piece | Article Data | Chronological |
| Paragraphs | Numeric | The number of paragraphs in the piece | WordCounter | 8 |
| Authorship | Categorical | How the publication obtained the piece | Article Data | Unsolicited(Freelance) |
| Visual | Binary | Are there any visual elements to the piece, graphs, photos, videos, etc. | Article Data | True |
| Reason | Categorical | What would the reason be for someone to read this piece | Article Data | Narrate |
| Recency | Date | What day was the article published | Article Data | 2020-03-03 |
Data Preparation
The training data you collect for modeling will require you to mark which articles were worthy of paywalling. This will allow the model to learn patterns between an article’s features and whether they are worthy. An article’s worthiness can be defined in a variety of ways, depending on the metrics an organization tracks. For example, an article can be labeled as worthy if it’s predicted to surpass a certain conversion rate in readers who read the article and subscribe.
Model Training
DataRobot Automated Machine Learning automates many parts of the modeling pipeline. Instead of hand-coding and manually testing dozens of models to find the one that best fits your needs, DataRobot automatically runs dozens of models and finds the most accurate one for you, all in a matter of minutes. In addition to training the models, DataRobot automates other steps in the modeling process such as processing and partitioning the dataset.
Take a look here to see how to use DataRobot from start to finish and how to understand the data science methodologies embedded in its automation.
A few key modeling decisions for this use case:
- Since we are dealing with an imbalanced dataset (there are significantly more articles classified as “unworthy”), the platform automatically recommends using Logloss, since it is an error metric which penalizes wrong predictions. (You can read more about this here.)
- DataRobot found that the model most suitable for the dataset was Light Gradient Boosting on ElasticNet Predictions, which comes from the open-source DMTK library.
Interpret Results
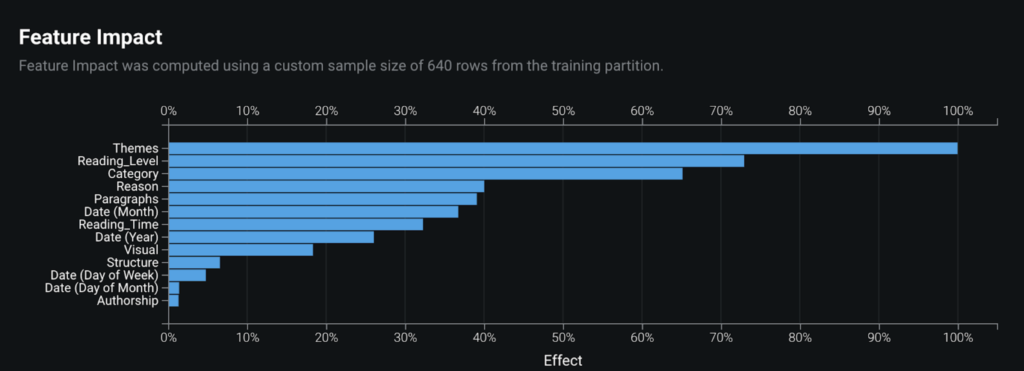
By taking a look at the feature importance chart (in the Feature Impact tab), we learn that the article’s themes, reading level, and category are the top three most impactful features that contribute to whether an article is likely to lead to a subscription.
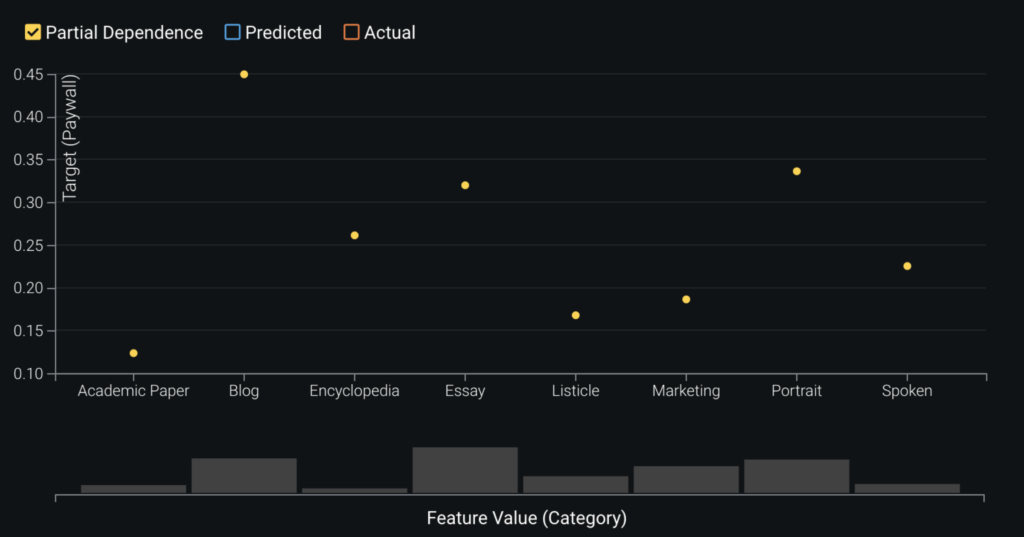
In assessing the partial dependence plots to further evaluate the marginal impact top features have on the predicted outcome. In the plot below, we see how each category either increases or decreases the likelihood of being “worthy.” For example, a blog increases the likelihood by 45% while a portrait only increases it by 34%. Maybe this means more blog posts should be locked behind the paywall.
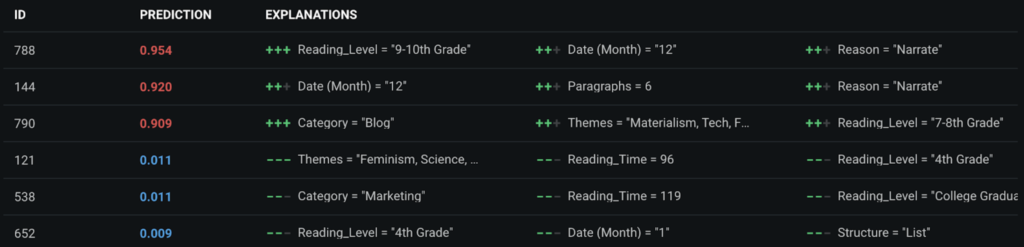
DataRobot’s Prediction Explanations provide a more granular view to interpret the model results. In the example image below, we can see why a given article was predicted to likely lead to a subscription, based on the top predictive features. In the article with ID 790, having materialism, tech, and family as its themes made it more likely to produce a subscription, while in the article with ID 538, having marketing as its category made is less likely to produce a subscription. Writers can use these predictions to tailor their new content to include the elements that have been seen to increase the likelihood. For example, this could mean deciding to write an article about tech but making sure it’s not marketing.
Evaluate Accuracy
In order to evaluate the performance of the model, DataRobot by default ran five-fold cross-validation, and the LogLoss score was around 0.387. As the LogLoss score on the holdout set (i.e., unseen data the model was not trained on) was around 0.409, this reassures us that the model is generalizing well and is not overfitting. The lower the LogLoss score (closer to 0) the better the model is able to separate the positive and negative prediction classes.
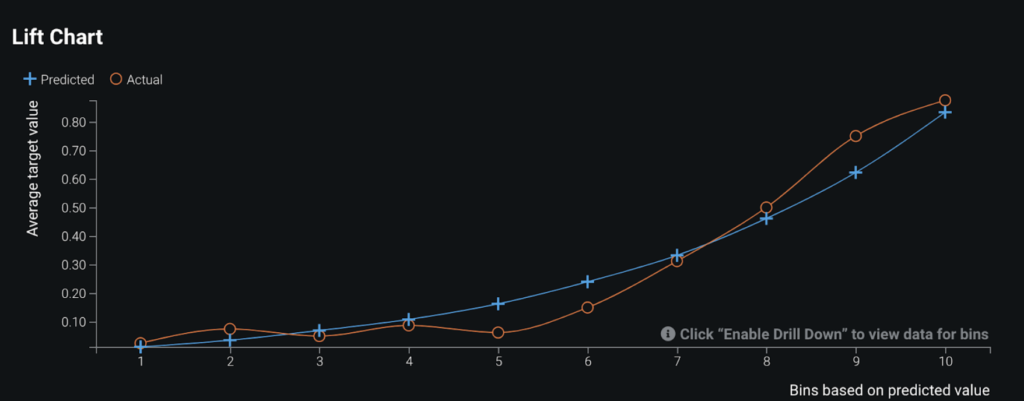
The Lift Chart below is a great way to visualize the model’s ability to separate the positive and negative prediction classes. The chart sorts the predictions the model made from lowest to highest and then groups them into bins. The blue line depicts the average predicted probability while the orange line identifies the average real (actual) probability. A good Lift Chart would have these lines very close to each other, as that would mean your model is making predictions close to the real values, and it should show a large gap in predicted value between the top and bottom bins. We see that our model does have minor over and under predictions, but overall the model does perform well.
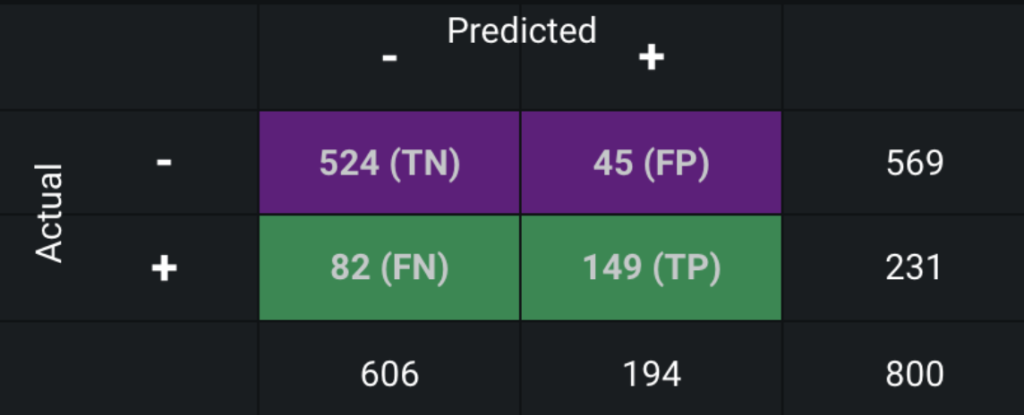
The confusion matrix makes it easy to see if the model is confusing two classes (consistently mislabeling one class as another class). The FN (false negatives) and FP (false positives) are the ones this model has misclassified, mistaking 127 samples out of the 800.
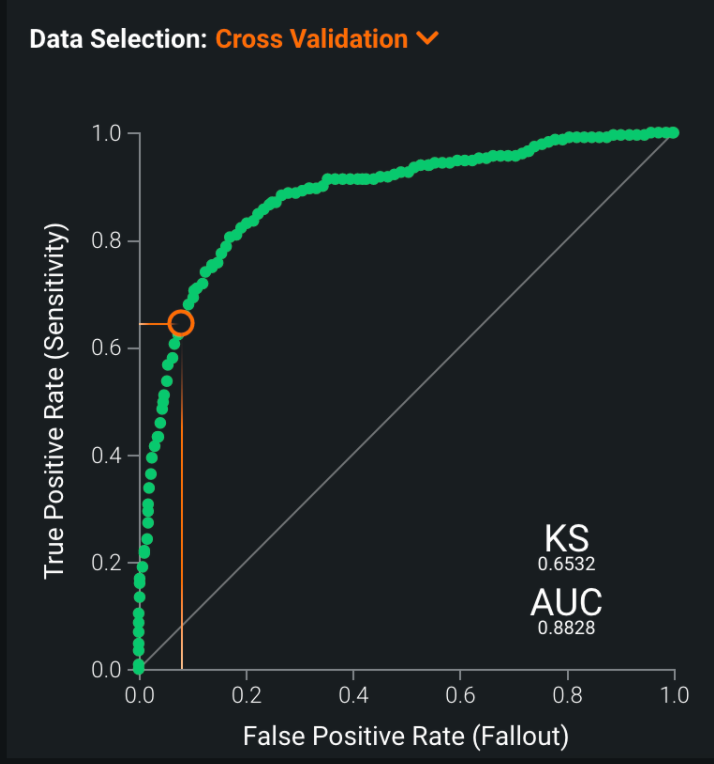
The ROC Curve is a graphical means of illustrating the classification performance. The curve illustrates the tradeoff between sensitivity and specificity: the ideal curve grows quickly for small x-values and slowly for values of x closer to 1. Another way to assess a good ROC Curve is to look at the “area under the curve” or AUC value, for which values closer to 1 are better. Our AUC value is 0.8828, which is relatively good.
Post-Processing
As mentioned above, the ROC Curve tab can be used to adjust the prediction threshold to optimize precision if required. In this case, we do not really need to optimize one precision over the other; however, if your company would rather have more articles falsely labeled not “worthy” than falsely labeled “worthy,” adjusting the threshold might be useful. We chose and depicted a 0.47 threshold because it minimized misclassifications overall. A business rule might be required to help establish a cutoff prediction probability.
You may also want to consider simplifying the model’s predictions so that decision executors have an easier time with interpretation. This can be done by post-processing the probabilistic predictions into labels such as high, medium, or low depending on where they fall in the threshold.
Business Implementation
Decision Environment
After you find the right model that best learns patterns in your data to predict the likelihood that an article will produce a subscription, DataRobot makes it easy to deploy the model into your desired decision environment. Decision environments are the ways in which the predictions generated by the model will be consumed by the appropriate stakeholders in your organization and how they will ultimately make decisions using the predictions that impact your process.
This is a critical piece of implementing the use case as it ensures that predictions are used in the real world to increase subscription revenue.
Decision Maturity
Automation | Augmentation | Blend
At its core, DataRobot empowers your editors and writers with the information they need to nurture strong and lasting connections with the people they care about most: their subscribers. While there are use cases where decisions can be automated in a data pipeline, this model is geared to augment the decisions of the editors and writers, whose knowledge and expertise is still valued. It acts as an intelligent machine with in-depth knowledge of how readers are interacting with your content, so it can help them adjust the focus, content, and paywall.
Model Deployment
The prediction can be consumed in many different ways. All the models built by DataRobot AutoML are immediately ready to be deployed through API, batch script, download, or drag and drop. Using DataRobot MLOps, you can monitor, maintain, and update models in a single platform.
DataRobot’s Predictor application is a frontend dashboard that makes it very easy for non-technical consumers to score new data. Predictor enables everyone in your organization to make predictions one-at-a-time by providing the required inputs, or make a large batch of predictions by importing a file. Compare the prediction result to the historical data from your training dataset to judge if the prediction score is high, low, or typical. Then view the Prediction Explanations and adjust input values to see how they affect the score.
Decision Stakeholders
Decision Executors
- Editors
- Writers
Decision Managers
- Digital publishers
Decision Authors
- Data scientists
- Business intelligence analyst
Decision Process
Thresholds can be set to determine whether a prediction constitutes locking down the article behind a paywall. Here are examples of specific actions or decisions the staff can apply to each prediction threshold:
- If an article has a high likelihood of leading to a subscription, they can prioritize this article in their content pipeline and social media.
- If medium, they can keep it outside the paywall to lure customers into subscription as a loss leader.
- If low, they can publish the article as content fillers during non-peak reading hours.
Model Monitoring
The Predictor application makes it very easy and fast to get one-at-a-time predictions; for example, a prediction could be made before publishing every new article.
Models should be retrained once data drift reaches a defined threshold; otherwise, you could retrain the models at the beginning of every new operating quarter.
Implementation Risks
Trying to automate all decisions will not work. It is important to decide which decisions to automate and which decisions to assign to humans. AI will only help supplement the decision making done by writers. The writers will still have to rely on their ingenuity to understand the rising social trends that people want to read about.
The size of the initial dataset is relatively small, so it is important to retrain the models often when more data becomes available. Even a few new data points improve the accuracy of predictions significantly.
Failure to retrain the model when new trends or events occur will make the predictions unsuitable. The models should be retrained when there are inherent shifts in social trends and readership.

Experience the DataRobot AI Platform
Less Friction, More AI. Get Started Today With a Free 30-Day Trial.
Sign Up for Free
Explore More Use Cases
-
MediaClassify Content Topics into Appropriate Categories
Improve your user experience by classifying your content under their appropriate topics.
Learn More -
MediaReduce Media Subscription Churn
Increase your subscription retention rates by predicting which customers will churn and intervening.
Learn More