

Predict B2B Customer Churn
Overview
Business Problem
From cloud computing to artificial intelligence, the growing number of players across many SaaS industries has resulted in intense competition for B2B companies trying to expand their customer base. For such companies, a fundamental metric for success is net revenue retention, which measures how well they are able to reduce churn while expanding existing relationships with customers. As the cost of new customer acquisition consumes significant financial and labor costs, customer retention and expansion are extremely important in building successful B2B software companies. Account managers at B2B software companies are able to minimize the likelihood of customer churn when they have foresight into which customers are at a high risk of leaving. Unfortunately, in many cases, account managers assessing the statuses of their customers are highly reliant on manual assessments that do not leverage all the data available. This prevents them from having an accurate view on which customers are likely to churn.
Intelligent Solution
While account managers are always going to be at the heart of any customer relationship, AI provides them with the data they need to make well-informed decisions that help maximize renewals. Using your data, AI will predict which customers will churn in their upcoming renewal and offer the top statistical reasons behind each prediction. With granular insights into the health of each customer, account managers can proactively focus on developing relationships with customers at a high risk of churn and strategize ways to reposition the engagement for success. Advancements in model explainability and transparency allow them to apply directed interventions for each unique customer. In all, the most valuable asset AI offers your account managers is additional time. Having foresight into which customer will churn weeks or months in advance provides your account managers with the time they need to develop the projects or relationships required for a successful renewal.
Technical Implementation
About the Data
For illustrative purposes, this tutorial uses a simulated dataset that includes the features a B2B enterprise collects in its customer relationship management (CRM) software. CRM software such as Salesforce allows enterprises to manage information about their customers from both pre-sales and post-sales activities. The customer data collected in CRMs are usually inputted manually by enterprise sales managers or can be automatically generated through pre-calculated fields. For enterprises, having the right data goes a long way in developing long-lasting customer relationships.
Problem Framing
The target variable for this use case is whether an existing customer will churn after the end of their current contract. Selecting this feature as the target variable makes this a binary classification problem as there are only 2 possible values to predict: churn or renew. In the dataset below, customers who churn are labeled as “Closed-Lost,” while customers who renew are labeled as “Closed-Won”.
The unit of analysis, which is what every row in the dataset represents, is a monthly snapshot of a customer and its descriptive features during the current month and previous months. These descriptive features include data about meetings, emails, users, and use cases.
As every enterprise likely collects unique data due to their personalized sales processes, we suggest incorporating any additional data your organization may collect that could be relevant to your customers’ likelihood of churn. As you will see later, DataRobot is able to quickly differentiate important vs unimportant features to help you understand which features you should keep.
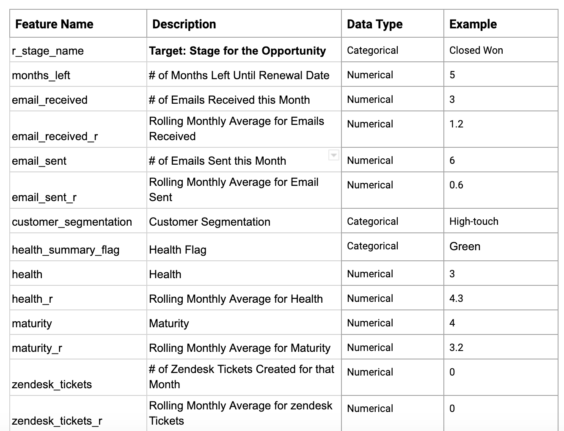
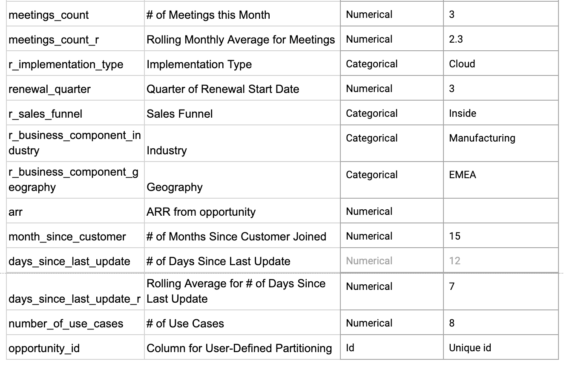
Sample Feature List
Data Preparation
For this use case, the features we include will originate from different tables such as Accounts, Emails, Meetings, and Support Tickets. After running queries to retrieve these unconnected pieces of data, the necessary features will need to be joined into a single dataset by using a common primary key such as the “account id” feature. The final data frame will also need to include the derived features used for the model (i.e. rolling averages).
Additionally:
- When making data schema changes in the future, ensure that the most impactful features are not modified to preserve model performance.
- After model training, identify the features that are low in the feature importance graph when compared to business intuition and investigate whether this is due to poor data quality or, if the results are genuine, communicate these results to senior management to dispel folklore on these theories.
Model Training
DataRobot automates many parts of the modeling pipeline. Instead of having to hand-code and test models, DataRobot automatically runs dozens and finds the best-performing one for you. It also automates other steps of the modeling process such as processing and partitioning the dataset.
We will jump straight to interpreting the model results. Take a look here to see how to use DataRobot from start to finish and how to understand the data science methodologies embedded in its automation.
For this use case, a few manual adjustments to the partitioning are required :
- Select group partitioning with group id = opportunity_id. This is a must-have as we have multiple records belonging to one opportunity and want all of them to go into the same data partition to avoid target leakage.
- Due to the low number of observations, we have to increase the number of cross-validation folds and remove the holdout partition completely. With this change, we increase the amount of data the models use to learn from, reduce the size of a single validation fold, but because of a larger number of cross-validation runs we will get a better estimate of the model’s performance in real life.
Interpret the Results
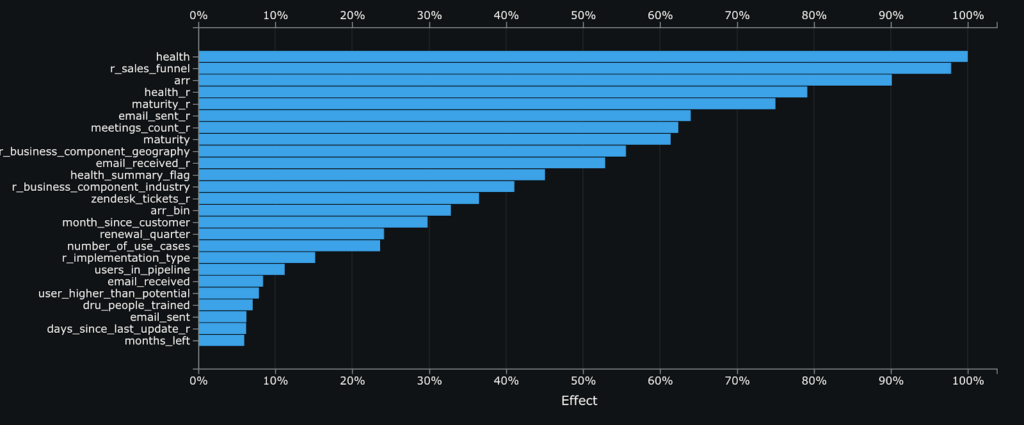
Feature Impact illustrates the importance of each feature to the model. Here, we see that the most important feature when predicting whether a customer will renew is the customer’s health, which is a flag manually set by the account team. This shows the model and account teams are well aligned in their perception of which customers are at high risk of churn. Other features worth mentioning include the average amount of emails sent and the number of meetings held every month.
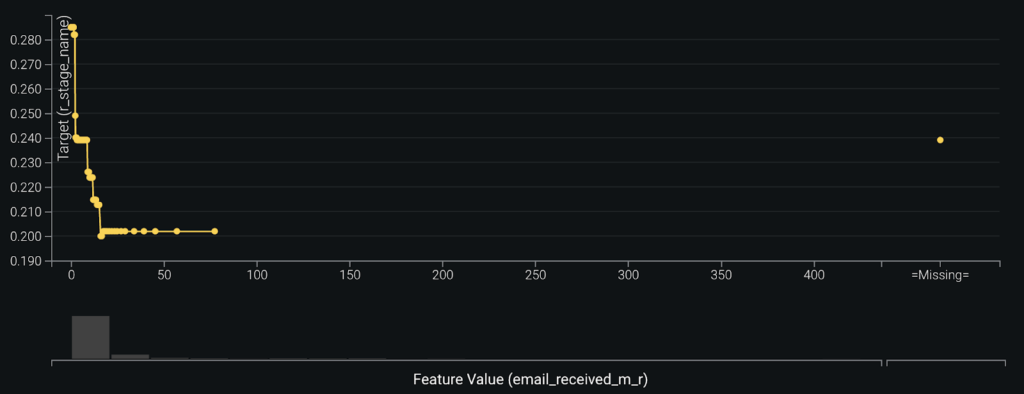
Feature Effects (aka Partial Dependence) helps give an additional level of visibility into the relationships between each feature and the customer’s likelihood of renewal. Taking a look at the Feature Effect for email_received_m_r shows that account teams that receive up to about 15 emails from customers are able to significantly reduce the customer’s likelihood of churn. This reflects the importance of keeping customers engaged through strong lines of communication. That said, the effect this feature has on reducing churn flattens after 15 emails, where additional emails don’t correspond to any further reduction in the predicted probability of churn.
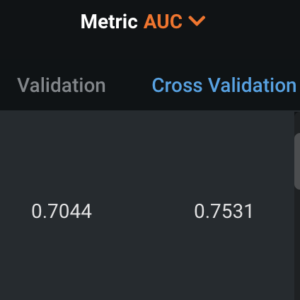
Evaluating Accuracy
To evaluate the performance of our model, we use the Area Under the Curve (AUC) metric to analyze how well the model is predicting overall. As a reference, an AUC of 0.5 indicates the model is predicting only as good as a random guess, while 1.0 means the model is predicting perfectly (this may also be a negative sign as the model is likely overfitting and won’t perform as well when in production). With our dataset, the best-performing model has an AUC of 0.75, which is acceptable for the first iteration of a model trained on a small dataset.
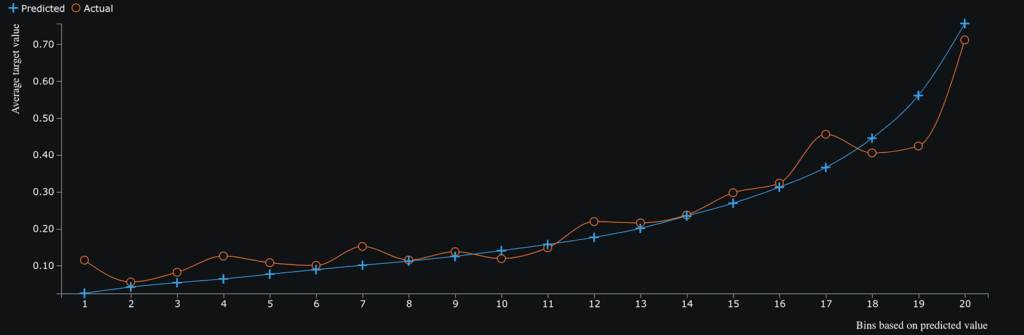
The lift chart below helps us visualize how well the model performs across 20 bins of probabilities, sorted from lowest to highest. The chart shows that the model performs quite accurately across the whole range of probabilities as there are few areas where the difference between the actual and predicted values is large. Several exceptions are bins 1, 17, and 19 where for those areas of predicted probabilities the model has slightly greater under and over predictions compared to their actual values.
Business Implementation
Decision Flow
After you choose the right model that best fits your data, DataRobot makes it easy to deploy the model into your desired decision environment. Decision environments are the methods by which predictions will ultimately be used for decision-making.
Decision Maturity
Automation | Augmentation | Blend
The predictions on which customers are likely to renew or churn will augment the decisions made by account executives on how they handle their customer relationships. In contrast to B2C products which can have tens of thousands (if not millions) of customers, B2B contracts require account managers to dedicate tailored attention to their customers. While a certain level of automation is possible, such as automating alerts on high-risk customers, customer intervention is ultimately still preferred to be manual. Due to each B2B customer’s unique and wide-ranging attributes, account managers can use the predictions generated from the model, along with the explainability behind them, to reduce the likelihood of churn by applying a solution tailored to the customer’s history and current state of engagement.
Model Deployment
DataRobot Drag and Drop | DataRobot Application |
Connect to a Database | Connection to Other Systems
DataRobot allows the model to be easily deployed to score new data on an ongoing basis. An example of a script that would do so can hold the following logic:
- Gather data from different tables in PostgreSQL
- Shape data into the required format
- Send data to a deployment, querying batch prediction jobs
- Receive predictions together with prediction explanations
- Store predictions and prediction explanations in a separate PostgreSQL table
The script can be scheduled to automatically trigger the batch process above every month.
Once the predictions are available in a relational database, we can visualize them in a business intelligence tool such as Tableau or Chart.io. The visualization would display granular information about each customer’s probability of churn, their prediction explanations, and other necessary information about the customer. From here, we can also send automated emails to account managers to regularly inform them of the state of the customer.
Decision Stakeholders
Decision Executors
Account Managers will be the primary consumers of the predictions. They can use the scores produced by the model to rank the customers within their portfolios by their likelihood of churn.
Decision Managers
Senior Sales Management can take a macro approach to analyze the customers at risk of churn to identify systemic issues or resource shortfalls. This allows them to reallocate company resources to empower overstretched customer support teams.
Decision Authors
Data Scientists or Engineers will be responsible for developing the model required to generate the predictions. Once the model is built, data scientists need to continuously enrich the data collection process to improve data quality for impactful features and identify auxiliary features that could also be relevant for the model.
Decision Process
The decisions taken will depend on the team which is acting on the results.
Customer success teams can:
- Rank order all their customers by their probability of churn and contract value
- Evaluate the necessary resource allocations required to improve relationships with high-risk customers
- Investigate the reasons behind why a customer is a high risk (potentially apply explanation clustering, example explored in our webinar) and devise a personalized strategy to “save” the customer based on their unique attributes
Senior management teams can:
- Have a holistic view of all the customers at risk across multiple geographies/industries and identify common attributes of risk that may not be visible for the account teams
- Track and measure the effectiveness of customer retention/intervention strategies by tracking changes in risk probabilities
Data management teams can:
- Identify key features and ensure consistent tracking of their data quality
- Identify other supplementary features in the database that are related to key features and add them for testing in the next iteration of the model
Model Monitoring
The model can be monitored using DataRobot MLOps, which provides the ability to continuously monitor the model’s service health, data drift, and accuracy. If anything about the model goes out of place, the corresponding team will get notified by email, investigate the deviation, and retrain the model if necessary.
How can the models be improved?
As the initial dataset may be relatively small, and new data points are likely to be received every week, the model can be automatically retrained on a monthly basis. A python script creates a training dataset, starts a project in DataRobot with predefined settings, and replaces the existing deployed model with the new version trained on the most recent data. The model with the Recommended for Deployment badge on the leaderboard is usually used as a replacement for a deployed model.
Implementation Risks:
- Changes to the underlying process. If the underlying process or features change they will reduce the quality of predictions.
- Data size. As the size of the training sets in the enterprise is relatively smaller compared to B2C, it is important to frequently retrain the models when more data is available. Even a few new data points can significantly improve the accuracy of predictions.
- Adoption of the new process. A lot of people have to adapt to the new process of having an AI-generated assessment of their accounts.
- Decision executors faking the inputs to get a better output. It is critical not to open information about the training data to the decision executors as they can change the way they input data into Salesforce in order to trick the model and get a better (lower) prediction on the probability of churn for their customers.
- Changes in customer behavior. Changes in customer behavior due to events such as COVID-19 could mean that the relationships discovered in the historical dataset might not hold in the future and hence the model’s accuracy can decay.
Accuracy decay will be harder to notice as the customer renewal cycle is slower in B2B than B2C. Data drift can be identified earlier, but model retraining might not be reasonable due to the low frequency of collection of new data.

Experience the DataRobot AI Platform
Less Friction, More AI. Get Started Today With a Free 30-Day Trial.
Sign Up for Free
Explore More Use Cases
-
TechnologyPredict Next CRM State to Inform Marketing
Predict which of your prospects will advance along your sales pipeline.
Learn More -
TechnologyMaximize Freemium Subscriber Conversion
Predict which free trial customers are likely to continue or cancel their subscription to a service at the end of their trial period and the key drivers of conversion and churn.
Learn More -
TechnologyMaximize Survey Response Rates
Predicting the likelihood that an individual recipient will respond to a survey.
Learn More -
TechnologyIdentify Anomalous Product Postings
Flag fraudulent and anomalous accounts or product postings.
Learn More