

Automatically Classify Product Defects
Overview
Business Problem
Defective materials reduce the efficiency of the manufacturing process. They not only create waste and excess production that fail to meet customer specifications but also result in production downtime, as an analysis would be required to identify the cause of the defect and conduct corrective action. The presence of defective materials also translates into the need for resource-intensive quality assurance processes. In all, product defects increase the costs of manufacturing and boost operational expenses.
Defects occur in manufacturing settings of all products, from consumer to industrial goods. In this example, we take a look at the challenges associated with defects in manufacturing steel sheets.
When it comes to steel sheets, an essential parameter for quality is the sheet’s surface. However, from scratches to crazings, a plethora of common occurrences reduce the quality of the sheet’s surface and cause it to become a defect. Each defect type can have a different effect on the manufacturing process and the finished product. Unfortunately, the existing process to identify these defects requires manual inspections which are resource-intensive, tedious assignments for maintenance engineers responsible for quality assurance.
Consequently, it is difficult to guarantee the delivery of flawless steel surfaces, leading to a variety of costs: direct costs (labor and inspection) and opportunity costs (production downtime and loss of realized profit).
Intelligent Solution
AI helps manufacturers significantly improve the efficiency and effectiveness of identifying defects of all kinds, including those for steel sheets. By leveraging advancements in computer vision, maintenance engineers can prevent defects from getting past their screening procedures, all while reducing the resources required. Computer vision has the ability to make predictions not only on tabular data but also on images.
Similar to the way humans learn to identify patterns from visual cues, computer vision will learn the patterns in images of your steel sheets to accurately classify which are defective. This augments the role of your maintenance engineers and enables them to monitor bigger batches of steel sheets. The results are used to qualify the achieved quality levels and correct any drifts in the upstream process.
With improvements in the usability of AI, maintenance engineers can now train and deploy models on their images without needing to hand-code deep learning models all by themselves. Subsequently, advancements in model interpretability allow them to leverage their subject matter expertise to evaluate how the model makes its predictions. They can then monitor and manage these models to respond to service interruptions.
As mentioned, the methods shown here to detect steel sheet defects can be applied to identify defects of any product or component.
Technical Implementation
Before We Get Started
In this guide, we will leverage DataRobot’s proprietary computer vision software called Visual AI to train models on images to identify steel defects (see here for more information about Visual AI). Contrary to traditional methods of computer vision, Visual AI does not require GPUs or millions of labeled images. Both subject matter experts and data scientists can create visually aware models with the images they currently have on product defects and continuously iterate these models by adding more images over time.
About the Data
For illustrative purposes, this guide uses publicly available data provided by an initiative at Northeastern University (description here). The initiative aims to provide an effective and robust automated approach to detect and classify defects. It includes a collection of 7K images of steel plates with 9 different classifications of defects.
We use DataRobot Visual AI to train deep learning models to identify the defect class by analyzing patterns in the pixels of the images.
Problem Framing
For this use case, we create a model that predicts the defect class. Each record in the data represents a unique steel plate.
The target variable for this use case is to classify whether a steel sheet falls into one of 9 different classifications of defects. This choice in target makes this a multi-class classification problem.
- Crazing
- Inclusion
- Patches
- Pitted Surface
- Roll Patches
- Rolled-in-scale
- Scratches
- Scratches in Pickling
- Sharp Scarring
The only feature we use here is a set of pictures on steel plate surfaces.
Beyond the image feature, we suggest incorporating any additional data your organization may collect that could be relevant to defect detection. DataRobot is able to combine any numeric, categorical, text, date features with images, and use them to collectively improve the accuracy of your models. DataRobot will quickly inform you of which features are important or unimportant, allowing you to iterate your feature list along the way.
Sample Feature List
| Feature Name | Data Type | Description |
|---|---|---|
| Class | Categorical (Target) | Classification of defect |
| Image | Image | Pictures of damaged steel plates |
Data Preparation
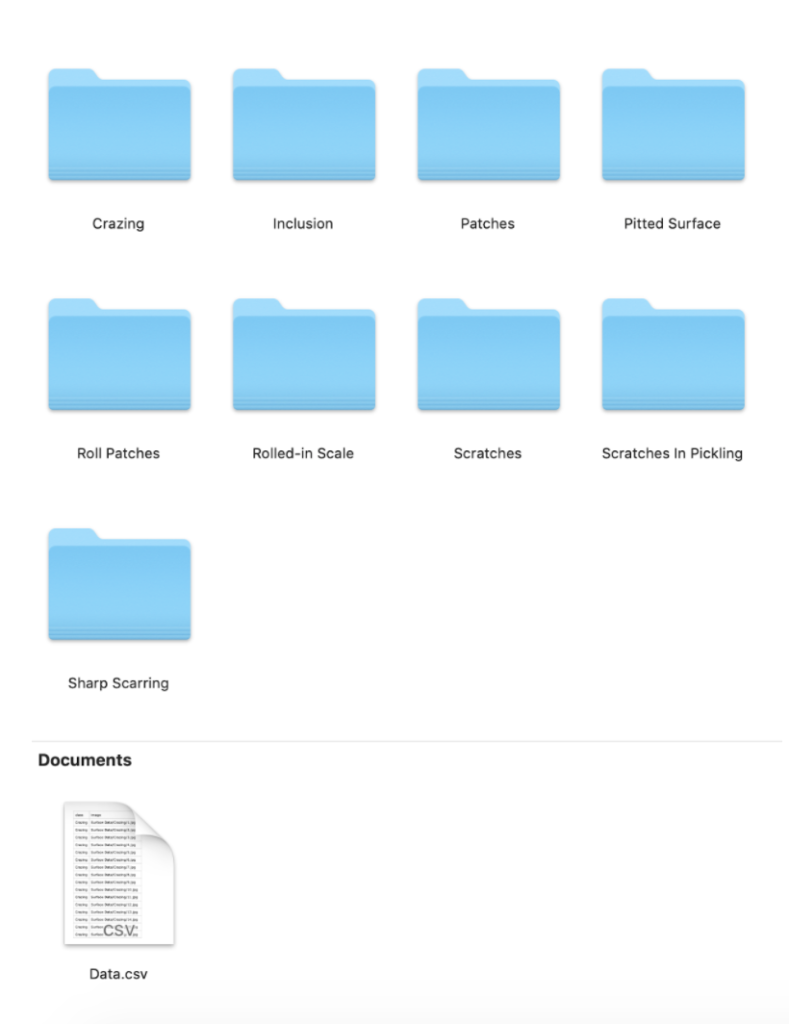
The dataset is made of a CSV file and folders containing images. Here are the steps needed to prepare the data for modeling:
- Create a SteelDefect folder
- Add all the images to this folder. You can create 9 sub-folders, one per each defect class; this is if you want to keep images organized by class defect, but is not mandatory
- Create a CSV file containing the target column (defect class)
- Add a column to the CSV file on the image source; the image source should be associated with the corresponding defect class of the steel sheet in the image
- Create a ZIP file from the SteelDefect folder
- Drag and drop, or upload, your ZIP file into DataRobot.
Take a look here to see further detailed steps on how to prepare your image datasets.
Model Training
DataRobot allows both novice and expert users to quickly and easily build explainable machine learning models using images. Simply upload a zip file of images into DataRobot to prepare to build new custom models to classify images or blend images with other feature types like numeric, categorical, and text to provide a broader set of data perspectives to your AI models.
You can get started with DataRobot with just a few hundred images and train models only using commodity hardware.
For brevity, we will jump straight to interpreting the model results. However, take a look here to see how to use DataRobot Visual AI from start to finish and to understand the data science methodologies embedded in its automation of developing new models.
Interpret the Results
In interpreting the model, several important questions include:
- Can you trust the model?
- Does the model behave like a human expert?
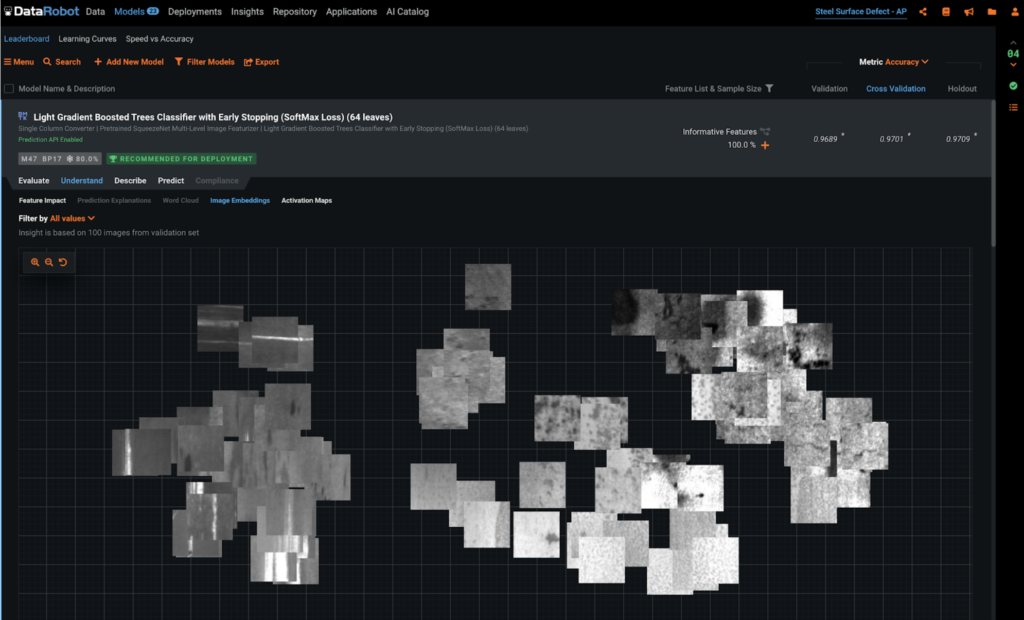
With DataRobot, you can now visually assess your models using two insight capabilities: embeddings and activation maps:
- DataRobot uses unsupervised learning approaches for image embeddings (Trimap). By taking a look at the Image Embeddings chart, you can see how the model groups “similar images” that represent different classes of defects. Visualizing how the model groups steel sheets by their defects allow maintenance engineers to ensure the model is identifying the right patterns. This also allows them to catch and correct the model if it is classifying images on illogical parts or if it is missing something obvious.
Is there anything considered similar that is clearly not? Here, we can see the model is identifying the right patterns.
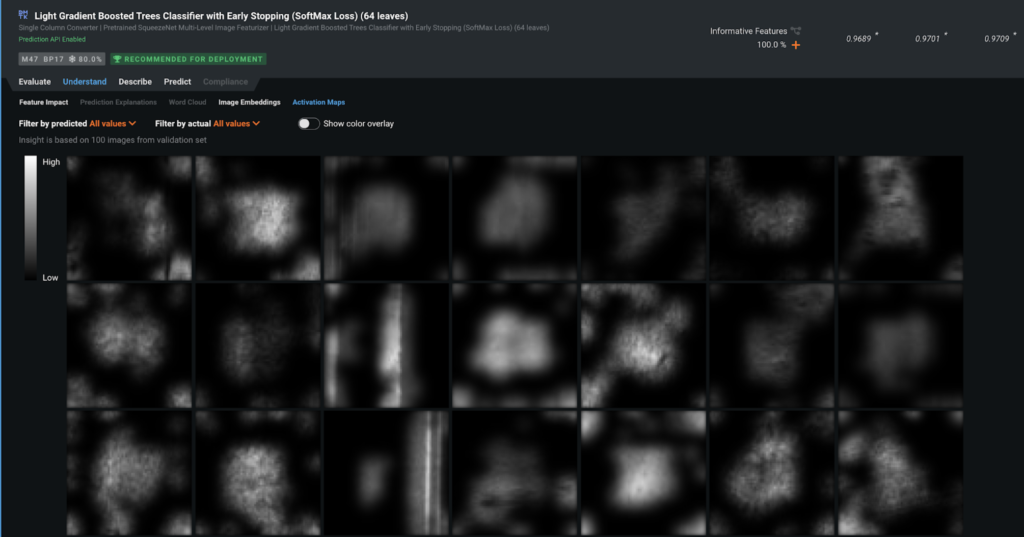
- Activation maps allow maintenance engineers to see what the model is paying attention to when predicting the defect class, making sure it is prioritizing the areas of the image where the defect is present and avoids over-analyzing extraneous parts of the image that are less relevant. They are computed similarly to how DataRobot computes numerical/categorical variables; DataRobot perturbs the data and sees how the prediction changes.
DataRobot automatically pulls a sample of images to create the surface activation maps, but images can also be analyzed on-demand. Simply upload a set of images to DataRobot to get activation maps for each image.
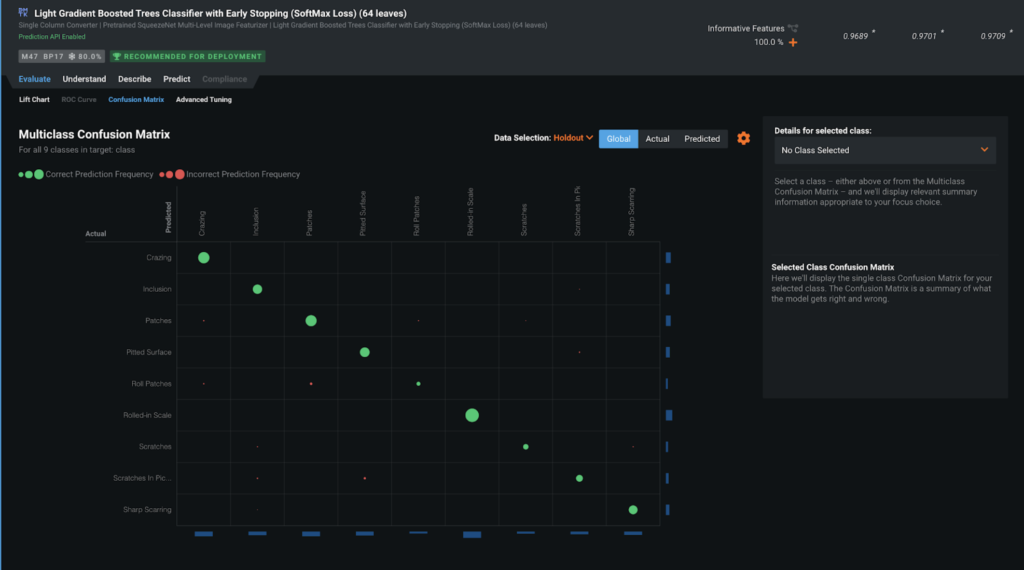
Evaluate Accuracy
DataRobot also allows you to evaluate the model’s accuracy in predicting the various classes of defects. A quick look at the confusion matrix for the recommended model shows that the model is performing accurately, with a limited number of steel sheets that are being misclassified (almost no red points in the off-diagonal cells).
Business Implementation
Decision Environment
After you develop the model, DataRobot makes it easy to deploy the model into your desired decision environment. Decision environments are the methods by which predictions will ultimately be used for decision making. This is a critical piece of implementing the use case as it ensures that predictions are used in the real world for reducing waste and cost.
Decision Maturity
Automation | Augmentation
DataRobot empowers your maintenance engineers with the information they need to identify potential defects and take appropriate action. While there are use cases where decisions can be automated in a data pipeline, a defect detection model is geared to augment the decisions of your maintenance engineers. It acts as an intelligent machine that, combined with the expertise of your engineers, will help remove waste and decrease costs.
Model Deployment
The predictions generated by the model can be integrated into your existing systems to be consumed by your maintenance engineers. Your system can include some of the following components: lighting technologies, optical filtering, data acquisition, and control hardware, embedded control, and monitoring software.
Several ways the prediction can be deployed include:
Connect the model output to a database: Store the detection request result in a database that can be accessed by a decision system.
Connect with other systems:
- Display results through a control and monitoring system
- Display results through a business intelligence tool (i.e., Tableau, Power BI)
Embed the predictions into your day-to-day production maintenance workflow. Results can be integrated into control and monitoring systems or BI dashboards. On the former, maintenance engineers can easily see decisions and alerts as an additional column in the data they already view on a daily basis to monitor their production flow. They will be given transparent interpretability of the predictions to visualize and understand why the model detects specific defects.
Decision Stakeholders
Decision executors are the maintenance engineers who will consume decisions on a daily basis to identify defects in production quality and understand the steps they can take to intervene.
Decision managers are the executive stakeholders who will monitor and manage the process to analyze the overall performance of the production process and decide when to invest in improvement programs.
Decision authors are the technical stakeholders who will set up the decision flow in place. These include system integrators, data scientists, or business analysts.
Decision Process
Your decision stakeholders can focus on leveraging the predictions generated by the model to augment decisions that will impact the process.
- Reduce production costs by reducing the rejection of defects and by reducing the reprocessing operations for the defective material. The majority of quality complaints from customers are surface defects.
- Reduce waste in effort, materials, and machine time. Detecting defects through visual inspection in the cold means up to several tons of defective material can continue to pass through costly production processes.
- Promote preventive maintenance. The presence of certain defects implies mistakes in the process, such as the deterioration of the rolling mill boxes, which can be anticipated and resolved via scheduled stops, and not when there is a final breakage that causes greater inconvenience.
- Increase the use of the line with fewer stops to research and determine the causes of the defects, especially as they are usually found at a later time when the products are cool.
- Save energy because less material is heated to comply with orders.
- Improve the know-how of your organization regarding its own production process. It is difficult to determine the many defects that can take place during the hot rolling process. This know-how means finding the causes of each type of defect and establishing an action plan to modify the production parameters in each case.
Model Monitoring
Decision Operators: IT/System Operations, Maintenance Engineers, Data Scientists
Prediction Cadence: Real-time predictions
Model Retraining Cadence: Models retrained once production processes change; otherwise, retrain the models at the beginning of every new operating quarter.
Implementation Risks
- Failing to integrate AI model to the production workflow to make predictions
- Failing to make predictions intuitive for experts to understand

Experience the DataRobot AI Platform
Less Friction, More AI. Get Started Today With a Free 30-Day Trial.
Sign Up for Free
Explore More Use Cases
-
ManufacturingPredict Whether a Parts Shortage Will Occur
Predict part shortages or late shipments in a supply chain network so that businesses can prepare for foreseeable delays and take data-driven corrective action
Learn More -
ManufacturingReduce Avoidable Returns
Predict which products will be returned and conduct a root cause analysis to prevent avoidable returns.
Learn More -
ManufacturingForecast Traffic Volume of Warehouse for Resource Planning
Forecast warehouse traffic to plan resources efficiently.
Learn More -
ManufacturingPredict Whether a Parts Failure Will Occur (Predictive Maintenance)
Using equipment sensor data, train a model to identify signals associated with an impending equipment failure so that preventative action can be taken.
Learn More